Examining Core Files
If a process encounters a serious error and dumps a core file, you can load the file to examine it.
If TotalView is not yet running, you can provide the core file as a startup argument, like so:
totalview filename corefile [ options ]
CLI: totalviewcli filename corefile [ options ] |
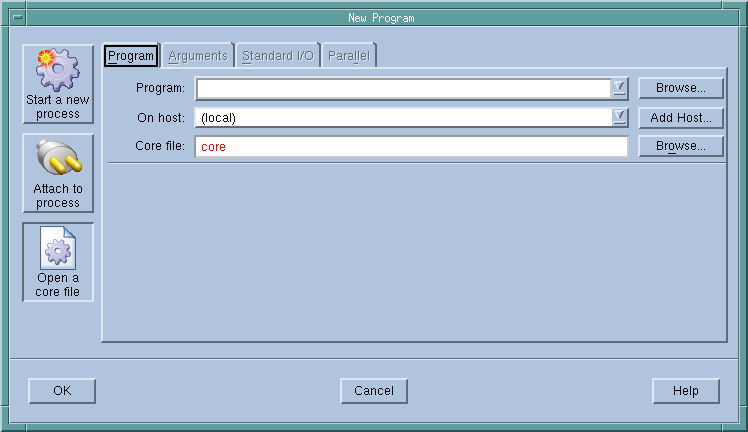
Alternatively, if TotalView is already running, you can select the
File > New Program command from the Root Window to launch the New Program dialog, and then select
Open a core file from the buttons on the left. Enter the program and core file’s name.
CLI: dattach -c corefile -e executable |
If the program and core file reside on another system, enter that system’s name in the host area.
If your operating system can create multi-threaded core files (and most can), TotalView can examine the thread in which the problem occurred. It can also show you information about other threads in your program.
The Process Window displays the core file, with the Stack Trace, Stack Frame, and Source Panes showing the state of the process when it dumped core. The title bar of the Process Window names the signal that caused the core dump. The right arrow in the line number area of the Source Pane indicates the value of the program counter (PC) when the process encountered the error.
You can examine the state of all variables at the time the error occurred. See
Chapter 8, “Examining and Editing Data and Program Elements,” .
If you start a process while you’re examining a core file, TotalView stops using the core file and switches to this new process.