Starting TotalView and Creating a Debugging Session
The most common way to start TotalView is by entering:
totalview program_name
where program_name is the executable of the program you are debugging.

To run a program in TotalView, compile it for debugging, usually with the -g command-line option, depending on your compiler.
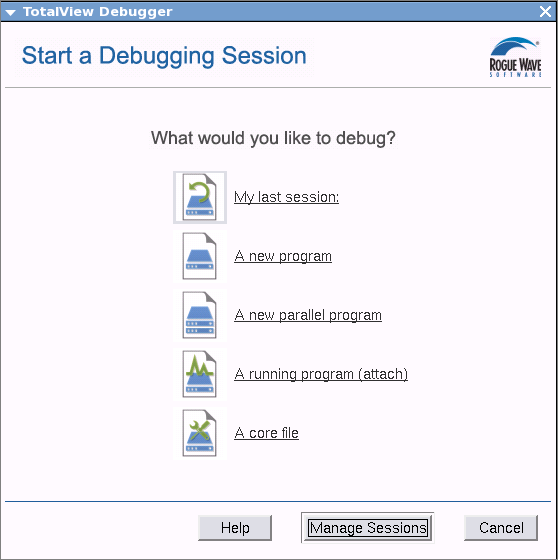
Starting TotalView with no arguments (i.e. just totalview) launches the Start a Debugging Session dialog.
This dialog is part of the Sessions Manager and is the easiest way to load a program into TotalView. Once you configure a debugging session using this dialog, the settings are saved so you can access them later.
From here, you can:
Open a debugging session
Select a type of session:
A new program
to launch the Program Session dialog and selecting a program to debug (equivalent to starting TotalView with a program name argument).
A new parallel program
to launch the Parallel Program Session dialog and entering parallel system settings.
A running program (attach)
to launch the Attach a running program(s) dialog and selecting an already-running process.
A core file
to launch the Core File Session dialog and selecting an executable and associated core file.
My last session
to launch a debugging session using your last session.
Manage your debugging sessions
Select Manage Sessions to edit, delete, or view the details of any saved sessions.
See More