Finding Memory Leaks
After you enable memory debugging, start your program. If you are working within TotalView, be sure to select Debug > Open MemoryScape to access MemoryScape’s features.
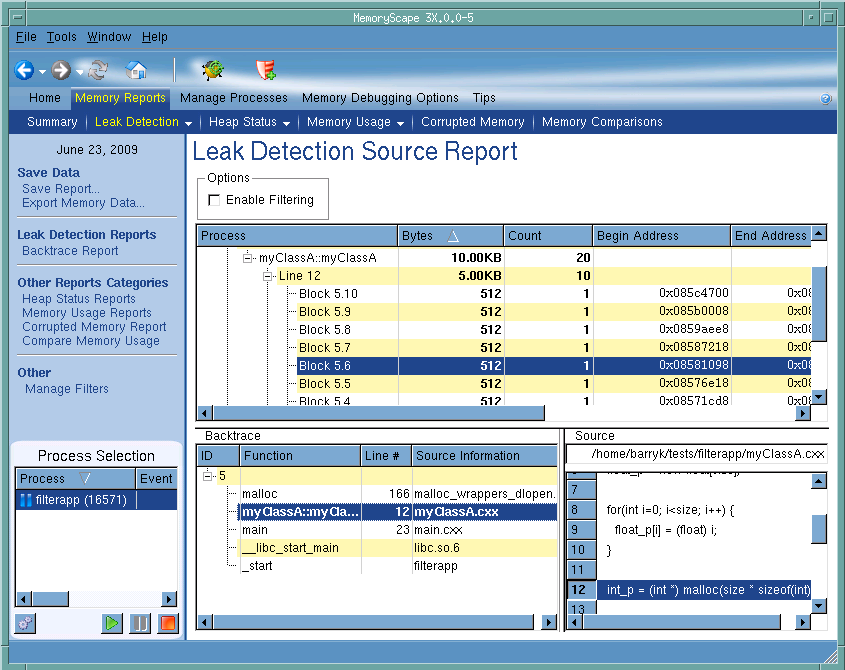
Whenever you stop execution, you can ask for a report of your program’s leaks.
When you click on a leak in the top part of the window, MemoryScape places the backtrace associated with the leak in the bottom part. When you click on a stack frame in this backtrace, MemoryScape displays the line within your program that allocated the memory.
See More