Run Your Program and Observe the Call Stack
Run the program by clicking Restart ( ) on the toolbar.
) on the toolbar.The program halts at the breakpoint with the PC at line 119: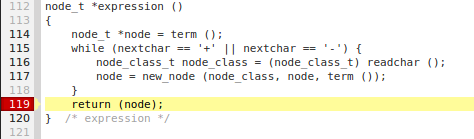
The Call Stack view shows that the program is stopped in the expression() function.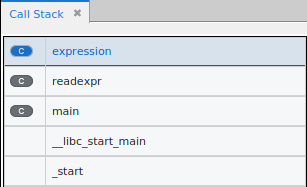
The Local Variables view displays any local variables in scope.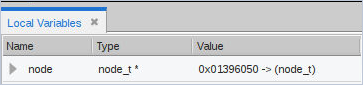
If you move the focus back up the call stack, the local variables in the Local Variables view update for the selected scope and the source related to that frame displays: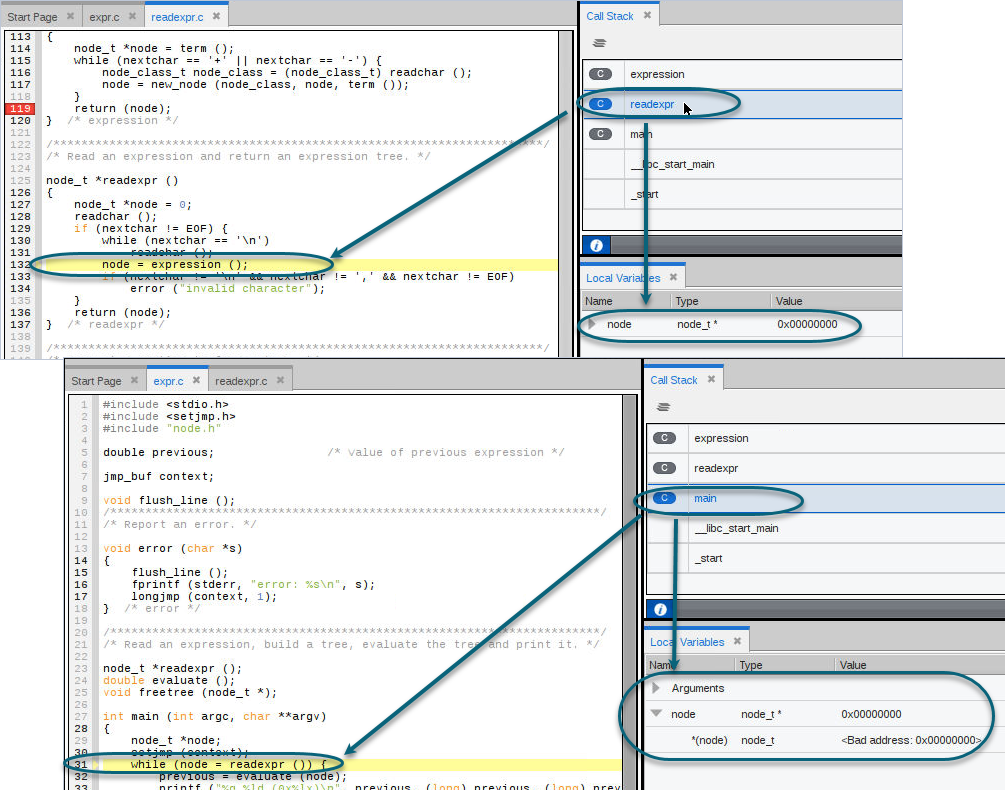
Action points, the Call Stack, and process/thread state |


