Access to the CLI
TotalView’s default settings display the Command Line view, which provides access to the CLI.
Figure 94, Command Line View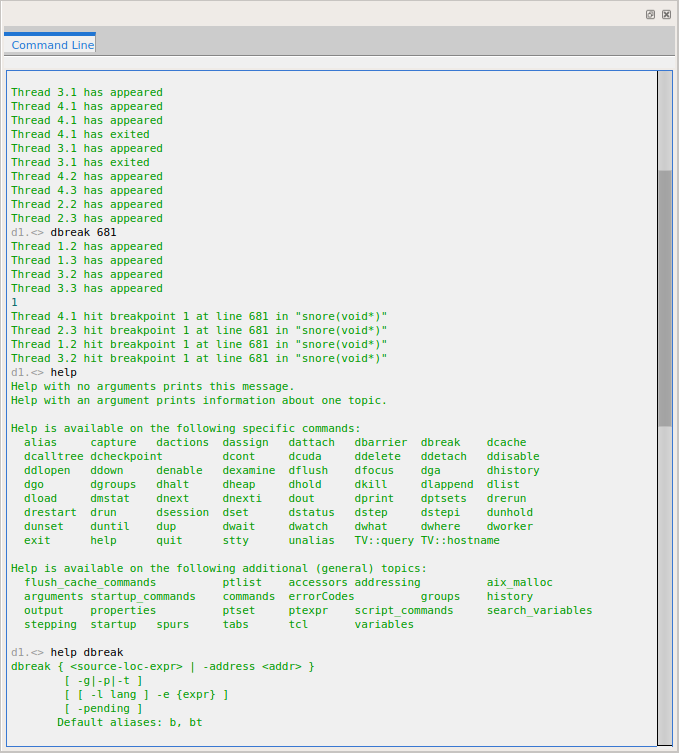
If the Command Line view is not present when you start TotalView, open it by:
Both of these are toggles that can also be used to close the view.
You can also access the CLI through a separate terminal window, as described in Starting the CLI in a Terminal Window.
The Command Line view gives you access to the help command that provides information on many of the common CLI commands, as shown in Figure 94for dhistory.
The Command Line view has two main uses, as represented in Figure 95.
Figure 95, Uses of the Command Line View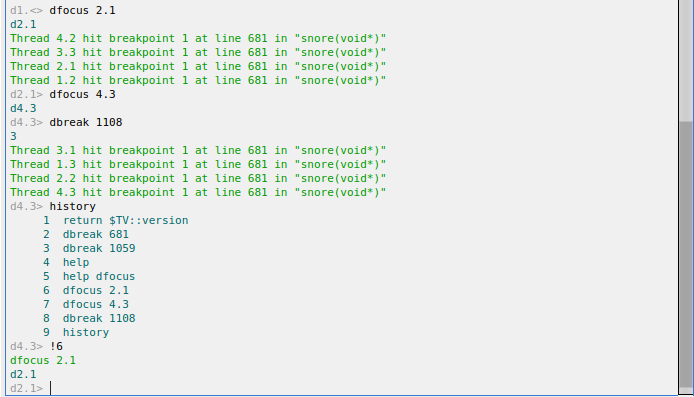
Note that the Command Line view supports command history. In Figure 95, typing history shows the list of commands executed so far. Entering the command !6 re-executes the command dfocus 2.1. Use the up‑arrow and down‑arrow keys to move up and down the history list.
This view also supports copy and paste, which works the same as most command line interfaces:
1. Select text by clicking and dragging.
2. Right-click and select Copy.
3. Right-click and select Paste to copy the selected text to the cursor position.
The remainder of this chapter describes the many ways to use the CLI to enhance your debugging session.


