Starting TotalView and Creating a Debugging Session
Start TotalView in two primary ways: with no arguments to launch the Start Page, or with arguments to skip the Start Page and open the UI with the program loaded and ready to debug.
The Start Page
If you start TotalView without arguments, the UI displays the Start Page, from which you can access the Sessions Editor. This is the easiest way to load a program into TotalView. Once you configure a debugging session using the Sessions Editor, the settings are saved under Recent Sessions so you can access them later.
Figure 14, Starting TotalView at the Start Page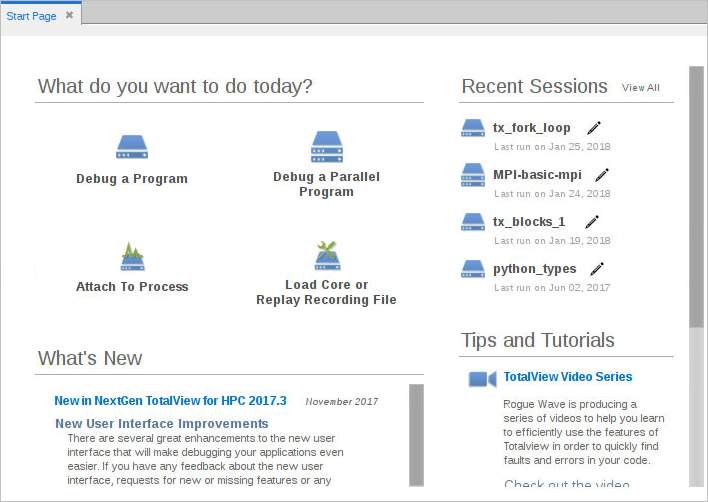
From this page you can:
Loading a program directly into TotalView
Load a program into TotalView by entering:
totalview executable_name [ argument argument ... ]
where executable_name is the executable of the program you want to debug, followed by any arguments the program takes. This opens the TotalView UI with the program loaded and ready to debug.
Figure 15 shows the Source view for the program and the Processes and Threads view. These are just two of several available views.
NOTE: To run a program in TotalView, compile it for debugging, usually with the -g command-line option, depending on your compiler.
Figure 15, Starting TotalView with an Executable Name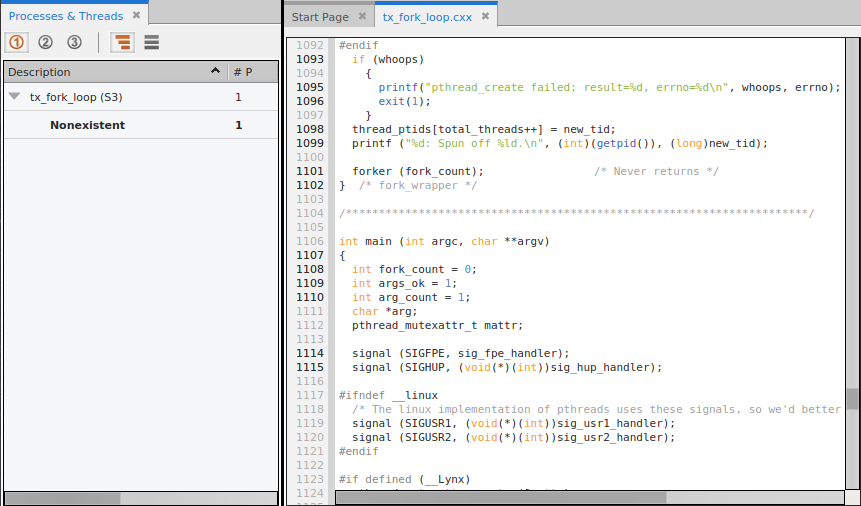
Defining, Editing, and Managing Sessions | |
More on compiling programs for debugging | |
More on starting TotalView |


