Debugging Events
This topic explains how to debug Zend Server monitoring events.
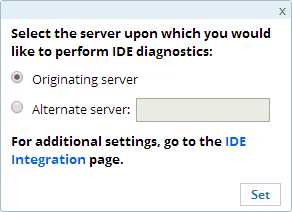
These actions can be applied to each event group to investigate what caused the event. By default, the settings are set to run diagnostic actions on the originating server (the server on which the event was created). You can change the settings to run on a different server.
Important:
These action items are only available if the IDE is installed on your machine, and Zend Server is configured to communicate with it. For more information, see Setting Up Debugging.
PhpStorm:
Before initiating a debugging/profiling session from Z-Ray, make sure PhpStorm is listening to debug connections. For more information, see PhpStorm documentation.
|
|
|
|
|
To debug events:
Note: These actions can be performed from the Events Details page. For any given event, go to the IDE Diagnostics area at the bottom of the page, and select one of the options described above. |
|
|
|
 in the Actions column on the right.
Debugging Events Using an Alternative Server
This procedure explains how to diagnose events using a different server than the one upon which the event originated on.
Important:
These action items are only available if the IDE is installed on your machine, and Zend Server is configured to communicate with it. For more information, see Setting Up Debugging.
|
|
|
|
|
To debug events using an alternative server:
|
|
Tip: If you are using the UI of a different server than the one upon which the event originated on, and would like to perform your IDE diagnostic actions on the originating server, follow the same steps and select Originating server in the IDE Diagnostics Settings dialog. |
|
 .
.
Copyright © 2016 Zend Technologies


