Importing Zend Server Trace Data
Importing Zend Server Trace Data allows you to view and analyze trace data (execution data) from your server. The execution data includes function call trees, arguments and return values, function execution duration, memory usage and indication for an executed files name and line of code. This enables you to capture problems when they occur, which eliminates the need to set up environments and reproduce the steps that led up to the failure.
Note:
In order to import Zend Server Event Data, you must first export Zend Server Event Data from your server. For more information see Exporting Trace Information in the Zend Server Online Documentation.
Having an active connection with a licensed version of Zend Server or Zend Server Cluster Manager allows you to fully integrate the Code Tracing feature. For more information see Zend Server.
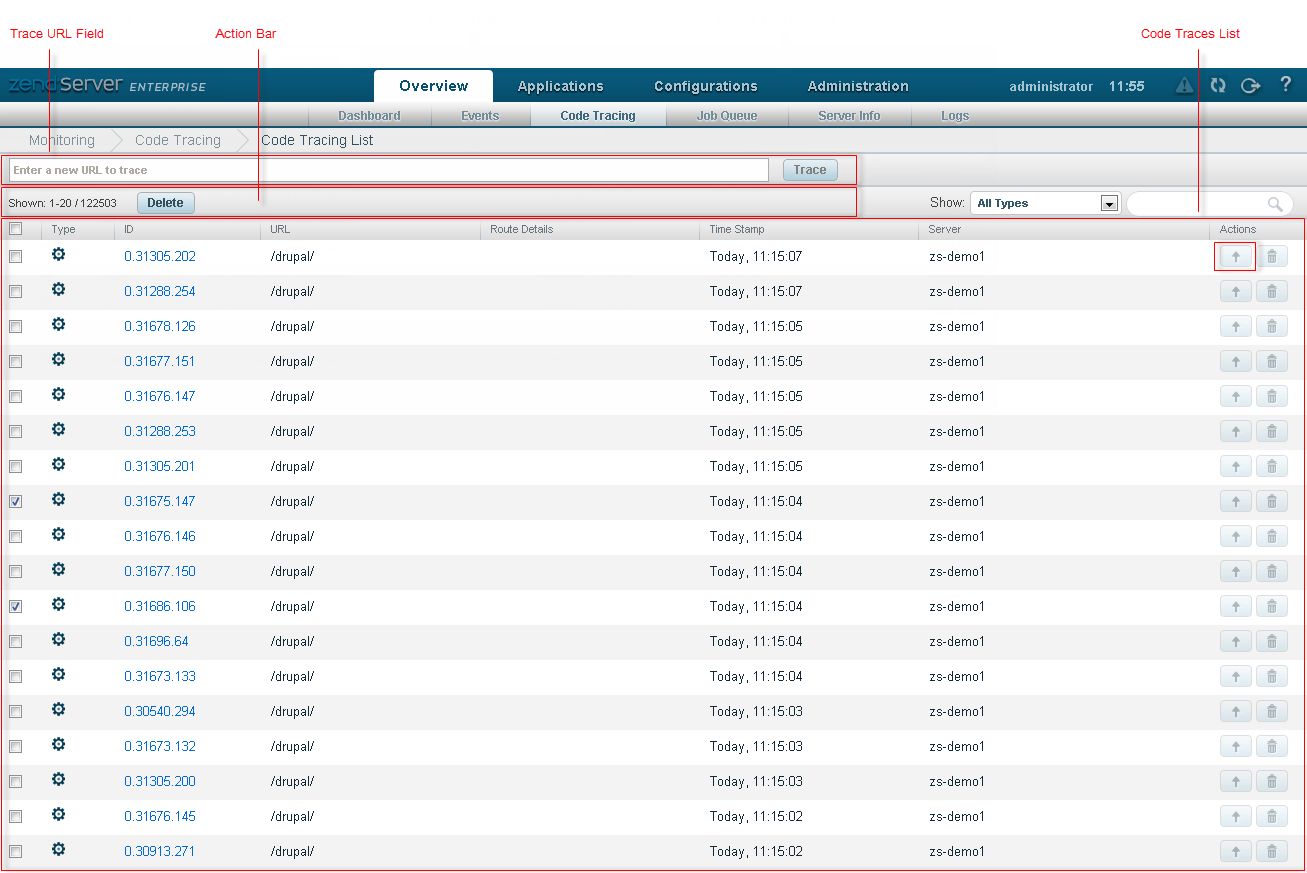
Exporting a Code Tracing File from Zend Server
This procedure describes how to export a Zend Server Code Tracing file (.amf).
|
|
|
|
|
To export a trace file from Zend Server :
|
|
Once a Zend Server event file has been exported it can be imported and debugged in Zend Studio. |
|
 on the right.
Importing a Code Tracing File into Zend Studio
This procedure describes how to import Zend Server Code Tracing file (.amf). into Zend Studio. Trace data in an . amf format can be imported and used to Open the Source of Trace Data even when there is no active connection with a Zend Server which contains the application.
|
|
|
|
|
To import a .amf Zend Server Event File:
|
|
For information about the working with the trace file in the Zend Server Code Tracing perspective, see Working with Code Tracing. |
|


|
|
|
|
|
Related Links: Opening the Source of Trace Data |
|
|
|

Copyright © 2017 Rogue Wave Software


