-
- All Implemented Interfaces:
- Serializable, Cloneable
public class SChart
extends ShewhartControlChart
SChartis an S chart using sample standard deviations to monitor the variability of a process. This is normally used with sample sizes greater than 10. The control limits are at
where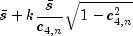
 is the mean of the within sample standard deviations,
n is the sample size,
and k is the value of the "ControlLimit" attribute for the line.
Additionally,
is the mean of the within sample standard deviations,
n is the sample size,
and k is the value of the "ControlLimit" attribute for the line.
Additionally,
is a factor such that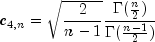
 is an unbiased estimator of the within sample standard deviation.
By default, the chart contains
an upper control limit line with k=3,
a lower control limit line with k=-3,
and a central line equal to
is an unbiased estimator of the within sample standard deviation.
By default, the chart contains
an upper control limit line with k=3,
a lower control limit line with k=-3,
and a central line equal to  .
Additional control limit lines can be added.
The method
.
Additional control limit lines can be added.
The method addWecoadds control limits with k = -2, -1, 1, 2.
-
-
Field Summary
-
Fields inherited from class com.imsl.chart.qc.ShewhartControlChart
d2, d3
-
Fields inherited from class com.imsl.chart.ChartNode
AXIS_X_TOP, AXIS_Y_RIGHT, BAR_TYPE_HORIZONTAL, BAR_TYPE_VERTICAL, DASH_PATTERN_DASH, DASH_PATTERN_DASH_DOT, DASH_PATTERN_DOT, DASH_PATTERN_SOLID, DATA_TYPE_FILL, DATA_TYPE_LINE, DATA_TYPE_MARKER, DATA_TYPE_PICTURE, DATA_TYPE_TUBE, DENDROGRAM_TYPE_HORIZONTAL, DENDROGRAM_TYPE_VERTICAL, FILL_TYPE_GRADIENT, FILL_TYPE_NONE, FILL_TYPE_PAINT, FILL_TYPE_SOLID, LABEL_TYPE_PERCENT, MARKER_TYPE_ASTERISK, MARKER_TYPE_CIRCLE_CIRCLE, MARKER_TYPE_CIRCLE_PLUS, MARKER_TYPE_CIRCLE_X, MARKER_TYPE_DIAMOND_PLUS, MARKER_TYPE_FILLED_CIRCLE, MARKER_TYPE_FILLED_DIAMOND, MARKER_TYPE_FILLED_SQUARE, MARKER_TYPE_FILLED_TRIANGLE, MARKER_TYPE_HOLLOW_CIRCLE, MARKER_TYPE_HOLLOW_DIAMOND, MARKER_TYPE_HOLLOW_SQUARE, MARKER_TYPE_HOLLOW_TRIANGLE, MARKER_TYPE_OCTAGON_PLUS, MARKER_TYPE_OCTAGON_X, MARKER_TYPE_PLUS, MARKER_TYPE_SQUARE_PLUS, MARKER_TYPE_SQUARE_X, MARKER_TYPE_X, TEXT_X_CENTER, TEXT_X_LEFT, TEXT_X_RIGHT, TEXT_Y_BOTTOM, TEXT_Y_CENTER, TEXT_Y_TOP
-
Fields inherited from class com.imsl.chart.AbstractChartNode
AUTOSCALE_DATA, AUTOSCALE_DENSITY, AUTOSCALE_NUMBER, AUTOSCALE_OFF, AUTOSCALE_WINDOW, AXIS_X, AXIS_Y, AXIS_Z, LABEL_TYPE_NONE, LABEL_TYPE_TITLE, LABEL_TYPE_X, LABEL_TYPE_Y, LABEL_TYPE_Z, TRANSFORM_CUSTOM, TRANSFORM_LINEAR, TRANSFORM_LOG
-
-
Constructor Summary
Constructors Constructor and Description SChart(AxisXY axis, double[][] x)Creates an S chart given sample data.SChart(AxisXY axis, int[] sampleSize, double[] s)Creates an S chart given the within sample standard deviations for a series of unequally sized samples.SChart(AxisXY axis, int sampleSize, double[] s)Creates an S chart given the within sample standard deviations for a series of equally sized samples.
-
Method Summary
Methods Modifier and Type Method and Description voidprePaint()Setup chart with current settings.-
Methods inherited from class com.imsl.chart.qc.ShewhartControlChart
addCenterLine, addControlLimit, addLowerControlLimit, addUpperControlLimit, addWecoLimits, dataRange, getCenter, getCenterLine, getControlData, getLowerControlLimit, getMeanSampleSize, getSampleSize, getUpperControlLimit, paint, removeControlLimit, setCenter, setData, setData, setSampleSize, setSampleSize, setX
-
Methods inherited from class com.imsl.chart.Data
formatLabel
-
Methods inherited from class com.imsl.chart.ChartNode
addPickListener, firePickListeners, getALT, getAxis, getBackground, getBarGap, getBarType, getBarWidth, getChart, getChartTitle, getChildren, getClipData, getComponent, getConcatenatedViewport, getDataType, getDoubleBuffering, getExplode, getFillOutlineColor, getFillOutlineType, getFillPaint, getFillType, getGradient, getHREF, getLegend, getLineDashPattern, getMarkerDashPattern, getMarkerThickness, getMarkerType, getParent, getReference, getScreenAxis, getScreenSize, getScreenViewport, getSize, getSkipWeekends, getTextAngle, getTextColor, getTitle, getToolTip, getViewport, isBitSet, removePickListener, setALT, setBarGap, setBarType, setBarWidth, setChartTitle, setClipData, setCustomTransform, setDataType, setDoubleBuffering, setExplode, setFillOutlineColor, setFillOutlineColor, setFillOutlineType, setFillPaint, setFillPaint, setFillPaint, setFillType, setGradient, setGradient, setGradient, setHREF, setImage, setLineDashPattern, setMarkerDashPattern, setMarkerThickness, setMarkerType, setReference, setScreenSize, setSize, setSkipWeekends, setTextAngle, setTextColor, setTextColor, setTitle, setTitle, setToolTip, setViewport, setViewport
-
Methods inherited from class com.imsl.chart.AbstractChartNode
clone, clone, clone, clone, getAbstractParent, getAttribute, getAutoscaleInput, getAutoscaleMinimumTimeInterval, getAutoscaleOutput, getBooleanAttribute, getChildList, getColorAttribute, getCustomTransform, getDensity, getDoubleAttribute, getFillColor, getFont, getFontName, getFontSize, getFontStyle, getImage, getIntegerAttribute, getLabelType, getLightColor, getLineColor, getLineWidth, getLocale, getMarkerColor, getMarkerSize, getName, getNumber, getPaint, getStringAttribute, getTextFormat, getTickLength, getTransform, getX, getY, isAncestorOf, isAttributeSet, isAttributeSetAtThisNode, parseColor, remove, setAttribute, setAutoscaleInput, setAutoscaleMinimumTimeInterval, setAutoscaleOutput, setDensity, setFillColor, setFillColor, setFont, setFontName, setFontSize, setFontStyle, setImage, setLabelType, setLightColor, setLightColor, setLineColor, setLineColor, setLineWidth, setLocale, setMarkerColor, setMarkerColor, setMarkerSize, setName, setNumber, setPaint, setTextFormat, setTextFormat, setTickLength, setTransform, setX, setY, toString
-
-
-
-
Constructor Detail
-
SChart
public SChart(AxisXY axis,
      double[][] x)
Creates an S chart given sample data.- Parameters:
axis- theAxisXYparent of this nodex- is an array of arrays containing sample data. The data of the i-th sample is inx[i]. Each row must have at least two entries.
-
SChart
public SChart(AxisXY axis,
      int[] sampleSize,
      double[] s)
Creates an S chart given the within sample standard deviations for a series of unequally sized samples.- Parameters:
axis- theAxisXYparent of this nodesampleSize- is an array containing the number of observations in each sample. All samples must have at least two observations.s- is an array containing the within sample standard deviations for a series of samples.- Throws:
IllegalArgumentException- is thrown if the two input arrays do not have the same length.
-
SChart
public SChart(AxisXY axis,
      int sampleSize,
      double[] s)
Creates an S chart given the within sample standard deviations for a series of equally sized samples.- Parameters:
axis- theAxisXYparent of this nodesampleSize- is the number of observations in each sample. It must be at least 2.s- is an array containing the within sample standard deviations for a series of samples.
-
-