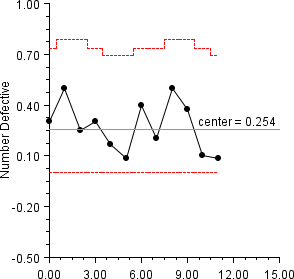
The number of defects in each of 12 samples was counted. The number of items in the samples varied from 8 to 12.
This class can be used either as an applet or as an application.
import com.imsl.chart.*;
import com.imsl.chart.qc.UChart;

public class UChartEx1 extends javax.swing.JApplet {

    static private final int numberDefects[] = {
        3, 4, 2, 3, 2, 1, 4, 2, 4, 3, 1, 1
    };
    static private final double sizeSample[] = {
        10, 8, 8, 10, 12, 12, 10, 10, 8, 8, 10, 12
    };

    public void init() {
        Chart chart = new Chart(this);
        JPanelChart panel = new JPanelChart(chart);
        getContentPane().add(panel, java.awt.BorderLayout.CENTER);
        setup(chart);
    }

    static private void setup(Chart chart) {
        AxisXY axis = new AxisXY(chart);
        axis.getAxisY().getAxisTitle().setTitle("Number Defective");
        UChart pcc = new UChart(axis, sizeSample, numberDefects);
    }

    public static void main(String argv[]) {
        JFrameChart frame = new JFrameChart();
        UChartEx1.setup(frame.getChart());
        frame.setVisible(true);
    }
}