Example: XbarS Chart
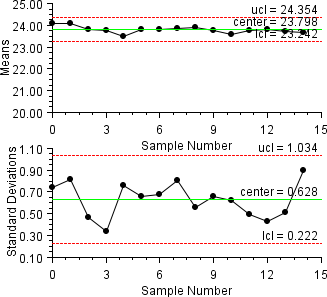
During a manufacturing process 15 samples, each containing 12 items, were measured. An XbarS chart was contructed from the 15 sample standard deviations. This class can be used either as an applet or as an application.
import com.imsl.chart.*;
import com.imsl.chart.qc.*;

public class XbarSEx1 extends javax.swing.JApplet {

    static private final double data[][] = {
        {23.97, 24.08, 23.16, 23.49, 24.73, 25.26,
            22.97, 23.12, 24.66, 24.20, 24.62, 24.56},
        {24.20, 24.50, 23.45, 22.22, 25.10, 24.41,
            24.05, 23.75, 23.89, 24.83, 25.21, 23.70},
        {23.73, 22.70, 23.54, 24.37, 24.08, 23.74,
            24.08, 23.95, 24.20, 23.43, 24.26, 23.61},
        {23.46, 23.14, 23.96, 23.37, 23.73, 24.29,
            24.13, 23.62, 24.08, 23.73, 23.91, 23.65},
        {23.95, 24.13, 22.95, 24.72, 24.40, 22.82,
            22.66, 22.71, 24.21, 23.39, 23.41, 22.56},
        {24.13, 24.28, 23.84, 24.55, 23.53, 23.77,
            24.38, 22.58, 24.47, 23.63, 22.64, 24.12},
        {23.69, 24.19, 24.76, 23.29, 24.84, 24.12,
            23.83, 22.60, 24.35, 22.96, 23.81, 23.46},
        {24.35, 23.11, 25.24, 24.10, 24.93, 22.93,
            23.47, 23.55, 23.91, 24.08, 22.45, 24.13},
        {24.98, 24.58, 23.52, 24.42, 23.90, 23.55,
            23.67, 24.25, 23.85, 23.08, 23.44, 23.43},
        {23.90, 24.04, 24.29, 23.62, 23.29, 23.16,
            24.34, 24.37, 24.19, 24.33, 22.17, 23.66},
        {23.51, 24.98, 24.34, 23.87, 23.29, 23.96,
            23.06, 23.47, 23.53, 22.87, 23.38, 22.86},
        {23.13, 23.17, 23.40, 23.68, 23.41, 23.67,
            23.37, 24.40, 24.64, 24.16, 24.17, 23.88},
        {23.52, 24.23, 24.25, 24.31, 23.89, 24.02,
            24.04, 23.83, 22.82, 23.93, 23.55, 23.40},
        {23.66, 23.59, 23.79, 24.07, 23.76, 23.34,
            23.65, 23.73, 25.12, 23.65, 23.23, 23.13},
        {23.04, 23.75, 22.84, 23.46, 21.72, 23.81,
            24.51, 24.01, 24.73, 23.88, 23.34, 24.98}
    };

    public void init() {
        Chart chart = new Chart(this);
        JPanelChart panel = new JPanelChart(chart);
        getContentPane().add(panel, java.awt.BorderLayout.CENTER);
        setup(chart);
    }

    static private void setup(Chart chart) {
        ShewhartControlChart control[] = XbarS.createCharts(chart, data);
    }

    public static void main(String argv[]) {
        JFrameChart frame = new JFrameChart();
        XbarSEx1.setup(frame.getChart());
        frame.setVisible(true);
    }
}
Output
Link to Java source.