Major and Minor Tick Marks
The nodes
MajorTick and
MinorTick control the drawing of tick marks on an
AxisXY.
The location of the major tick marks can be set explicitly, using the
Axis1D.setTicks(double[]) method. However, it is usually easier to allow autoscaling to automatically set the tick locations (see the section
Autoscale).
Attribute TickLength
The length of the tick marks is proportional to the screen size. They can be made relatively longer or shorter by setting the attribute TickLength. Its default value is 1.0. If its value is negative, the tick marks are drawn in the opposite direction: i.e., into the center of the plot region rather than away from it.
Attribute Number
Number is the number of major tick marks along an axis.
Attribute Density
Density is the number of minor tick marks in each interval between major tick marks. The minor ticks are equally spaced in user coordinates. If the Transform attribute in not
TRANSFORM_LINEAR, then they will not be equally spaced on the screen.
Attribute FirstTick
The
FirstTick attribute, in an
Axis1D node, is the position of the first major tick mark. The default value is the 0-th element of the
Windows attribute.
Attribute TickInterval
The
TickInterval attribute, in an
Axis1D node, is the interval between tick marks in the user coordinates. If this attribute is not explicitly set, its value is computed from the attributes
Number,
Window, and
Transform.
Attribute Ticks
The
Ticks attribute, in an
Axis1D node, contains the position of the major tick marks. If this attribute is not explicitly set, its value is computed from the attributes FirstTick, TickInterval,
Number,
Window, and
Transform.
Example
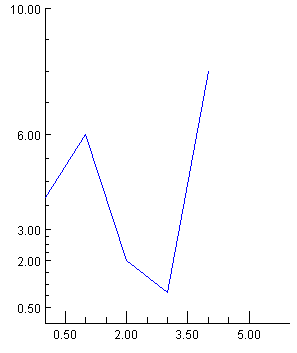
This example shows the effects of the tick mark attributes. Note that autoscaling is turned off so that the attribute values are not overridden (see the section
Autoscale).
On the x-axis, there are four major tick marks (Number), starting with 0.5 (FirstTick) at an interval of 1.5 (TickInterval). There are three minor tick intervals (Density) between each major tick mark. The tick marks are twice as long and are drawn in the opposite direction as normal (TickLength).
On the y-axis, the tick mark locations are set explicitly by the attribute Ticks. This automatically sets the attribute Number. The TickLength is set to -1, so the tick marks are drawn inward (to the right) instead of outward (to the left).
import com.imsl.chart.*;
import java.awt.Color;
public class SampleTicks extends JFrameChart {
public SampleTicks() {
Chart chart = getChart();
AxisXY axis = new AxisXY(chart);
axis.setAutoscaleOutput(axis.AUTOSCALE_OFF);
axis.getAxisX().setWindow(0.0, 6.0);
axis.getAxisX().setDensity(3);
axis.getAxisX().setNumber(4);
axis.getAxisX().setFirstTick(0.5);
axis.getAxisX().setTickInterval(1.5);
axis.getAxisX().setTickLength(-2);
axis.getAxisY().setWindow(0.0, 10.0);
double ticksY[] = {0.5, 2.0, 3.0, 6.0, 10.0};
axis.getAxisY().setTicks(ticksY);
axis.getAxisY().setTickLength(-1);
double y[] = {4, 6, 2, 1, 8};
Data data = new Data(axis, y);
data.setDataType(Data.DATA_TYPE_LINE);
data.setLineColor(Color.blue);
}
public static void main(String argv[]) {
new SampleTicks().setVisible(true);
}
}