Example: Box Plot Chart
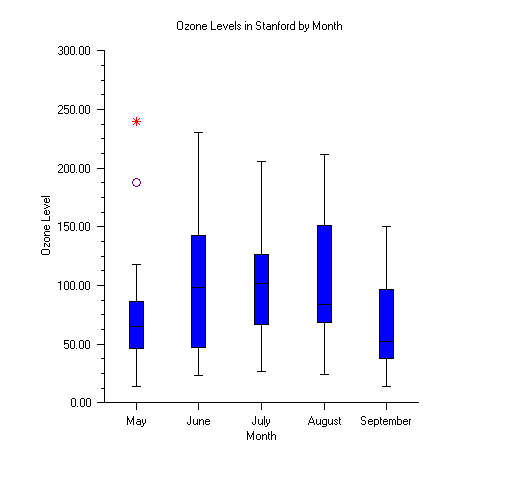
A simple box plot chart is constructed in this example. Display of far and outside values is turned on.
using Imsl.Chart2D;
using System;
using System.Windows.Forms;

public class BoxPlotEx1 : FrameChart
{
    public BoxPlotEx1()
    {
        Chart chart = this.Chart;

        double[][] obs = {new double[]{66.0, 52.0, 49.0, 64.0, 68.0, 26.0, 86.0,
                                       52.0, 43.0, 75.0, 87.0, 188.0, 118.0,
                                       103.0, 82.0, 71.0, 103.0, 240.0, 31.0,
                                       40.0, 47.0, 51.0, 31.0, 47.0, 14.0,
                                       71.0},

                             new double[]{61.0, 47.0, 196.0, 131.0, 173.0, 37.0, 47.0,
                                     215.0, 230.0, 69.0, 98.0, 125.0, 94.0,
                                     72.0, 72.0, 125.0, 143.0, 192.0, 122.0,
                                     32.0, 114.0, 32.0, 23.0, 71.0, 38.0,
                                     136.0, 169.0},

                             new double[]{152.0, 201.0, 134.0, 206.0, 92.0, 101.0,
                                     119.0, 124.0, 133.0, 83.0, 60.0, 124.0,
                                     142.0, 124.0, 64.0, 75.0, 103.0, 46.0,
                                     68.0, 87.0, 27.0, 73.0, 59.0, 119.0, 64.0,
                                     111.0},

                             new double[]{80.0, 68.0, 24.0, 24.0, 82.0, 100.0, 55.0,
                                     91.0, 87.0, 64.0, 170.0, 86.0, 202.0,
                                     71.0, 85.0, 122.0, 155.0, 80.0, 71.0,
                                     28.0, 212.0, 80.0, 24.0, 80.0, 169.0,
                                     174.0, 141.0, 202.0},

                             new double[]{113.0, 38.0, 38.0, 28.0, 52.0, 14.0, 38.0,
                                     94.0, 89.0, 99.0, 150.0, 146.0, 113.0,
                                     38.0, 66.0, 38.0, 80.0, 80.0, 99.0, 71.0,
                                     42.0, 52.0, 33.0, 38.0, 24.0, 61.0,
                                     108.0, 38.0, 28.0}};

        double[] x = new double[]{1.0, 2.0, 3.0, 4.0, 5.0};
        System.String[] xLabels = new System.String[]{"May", "June", "July",
                                                      "August", "September"};

        //   Create an instance of a BoxPlot Chart
        AxisXY axis = new AxisXY(chart);
        BoxPlot boxPlot = new BoxPlot(axis, obs);
        boxPlot.SetLabels(xLabels);

        // Customize the fill color and the outside and far markers
        boxPlot.Bodies.FillColor = System.Drawing.Color.FromName("blue");
        boxPlot.OutsideMarkers.MarkerType =
         Imsl.Chart2D.BoxPlot.MARKER_TYPE_HOLLOW_CIRCLE;
        boxPlot.OutsideMarkers.MarkerColor =
         System.Drawing.Color.FromName("purple");
        boxPlot.FarMarkers.MarkerType =
         Imsl.Chart2D.BoxPlot.MARKER_TYPE_ASTERISK;
        boxPlot.FarMarkers.MarkerColor =
         System.Drawing.Color.FromName("red");

        // Set titles
        chart.ChartTitle.SetTitle("Ozone Levels in Stanford by Month");
        axis.AxisX.AxisTitle.SetTitle("Month");
        axis.AxisY.AxisTitle.SetTitle("Ozone Level");

    }

    public static void Main(string[] argv)
    {
        System.Windows.Forms.Application.Run(new BoxPlotEx1());
    }
}
Output
Link to C# source.