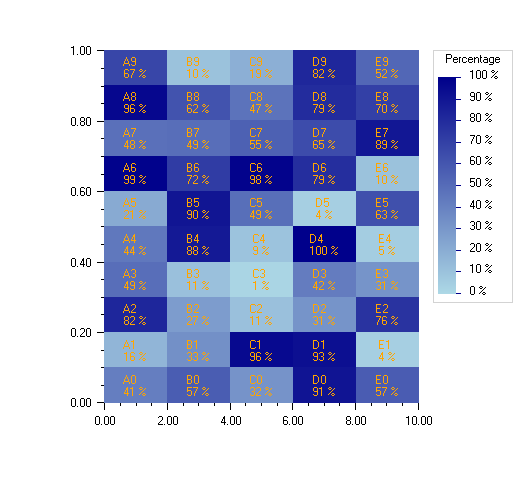
The legend is enabled by setting its paint attribute to true. The tick marks in the legend are formatted using the percentage NumberFormat
object. A title is also set in the legend.
using Imsl.Chart2D;
using System;
using System.Windows.Forms;

public class HeatmapEx3 : FrameChart
{
    public HeatmapEx3()
    {
        Chart chart = this.Chart;

        AxisXY axis = new AxisXY(chart);

        double xmin = 0.0;
        double xmax = 10.0;
        double ymin = 0.0;
        double ymax = 1.0;

        int nx = 5;
        int ny = 10;
        double[,] data = new double[nx,ny];

        System.String[,] labels = new System.String[nx,ny];
        System.Random random = new System.Random((System.Int32) 123457L);

        double[] dbl = new double[50];
        dbl[0]=0.41312962995625035;
        dbl[1]=0.15995876895053263;
        dbl[2]=0.8225528716547005;
        dbl[3]=0.48794367683379836;
        dbl[4]=0.44364905186692527;
        dbl[5]=0.20896329070872555;
        dbl[6]=0.9887088342522812;
        dbl[7]=0.4781765623804778;
        dbl[8]=0.9647868112234352;
        dbl[9]=0.6732389937186418;
        dbl[10]=0.5668831243079411;
        dbl[11]=0.33081942994459734;
        dbl[12]=0.27386697614898103;
        dbl[13]=0.10880787186704965;
        dbl[14]=0.8805853693809824;
        dbl[15]=0.901138442534768;
        dbl[16]=0.7180829622748057;
        dbl[17]=0.48723656383264413;
        dbl[18]=0.6153607537410654;
        dbl[19]=0.10153552805288812;
        dbl[20]=0.3158193853638753;
        dbl[21]=0.9558058275075961;
        dbl[22]=0.10778543304578747;
        dbl[23]=0.011829287599608884;
        dbl[24]=0.09275375134615693;
        dbl[25]=0.4859902873228249;
        dbl[26]=0.9817642781628322;
        dbl[27]=0.5505301300240635;
        dbl[28]=0.467363186309925;
        dbl[29]=0.18652444274911184;
        dbl[30]=0.9066980293517674;
        dbl[31]=0.9272326533193322;
        dbl[32]=0.31440695305815347;
        dbl[33]=0.4215880116306273;
        dbl[34]=0.9991560762956562;
        dbl[35]=0.0386317648903991;
        dbl[36]=0.785150345014761;
        dbl[37]=0.6451521871931544;
        dbl[38]=0.7930129038729785;
        dbl[39]=0.819301055474355;
        dbl[40]=0.5695413465811706;
        dbl[41]=0.039285689951912395;
        dbl[42]=0.7625752595574732;
        dbl[43]=0.31325564481720314;
        dbl[44]=0.0482465474704169;
        dbl[45]=0.6272275622766595;
        dbl[46]=0.09904819350827354;
        dbl[47]=0.8934533907186641;
        dbl[48]=0.7013979421419555;
        dbl[49]=0.5212913217641422;

        int z=0;
        for (int i = 0; i < nx; i++)
        {
            for (int j = 0; j < ny; j++)
            {
                data[i,j] = dbl[z];//random.NextDouble();
                z++;
                labels[i,j] = "ABCDE"[i] + System.Convert.ToString(j) + "\n" +
               data[i,j].ToString("P0");
            }
        }
        Heatmap heatmap = new Heatmap(axis, xmin, xmax, ymin, ymax, 0.0, 1.0,
         data, Imsl.Chart2D.Colormap_Fields.BLUE);
        heatmap.SetHeatmapLabels(labels);
        heatmap.TextColor =  System.Drawing.Color.FromName("orange");
        heatmap.HeatmapLegend.IsVisible = true;
        heatmap.HeatmapLegend.TextFormat = "P0";
        heatmap.HeatmapLegend.SetTitle("Percentage");
    }

    public static void Main(string[] argv)
    {
        System.Windows.Forms.Application.Run(new HeatmapEx3());
    }
}