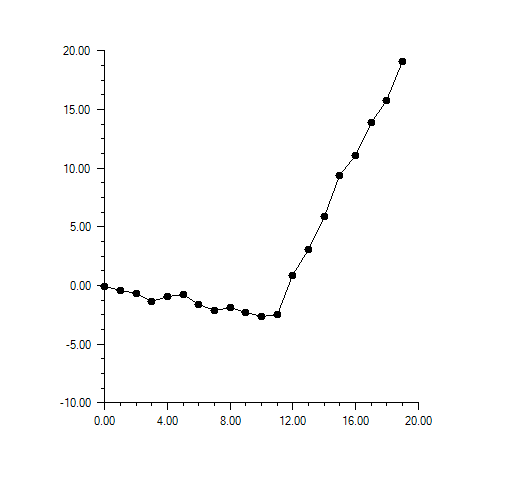
Example: CuSum Chart
A CuSum chart is constructed from the data at NIST Engineering Statistics Handbook: CuSum Control Charts
.
using Imsl.Chart2D;
using Imsl.Chart2D.QC;
using System;

public class CuSumEx1 : FrameChart
{
	static private readonly double[] data = {
		324.925, 324.675, 324.725, 324.350, 325.350, 325.225, 324.125,
		324.525, 325.225, 324.600, 324.625, 325.150, 328.325, 327.250,
		327.825, 328.500, 326.675, 327.775, 326.875, 328.350
	};

	public CuSumEx1()
	{
		AxisXY axis = new AxisXY(this.Chart);
		double mean = 325;
		CuSum cusum = new CuSum(axis, data);
		cusum.ExpectedMean = mean;
	}

	public static void Main(string[] argv)
	{
		System.Windows.Forms.Application.Run(new CuSumEx1());
	}
}
Output
Link to C# source.