Example: EWMA Chart
A process is monitored using the EWMA control chart. The data is from NIST Engineering Statistics Handbook: EWMA Control Charts
.
using Imsl.Chart2D;
using Imsl.Chart2D.QC;
using System;

public class EWMAEx1 : FrameChart
{
	static private readonly double[] data = {
		52.0, 47.0, 53.0, 49.3, 50.1, 47.0,
		51.0, 50.1, 51.2, 50.5, 49.6, 47.6,
		49.9, 51.3, 47.8, 51.2, 52.6, 52.4,
		53.6, 52.1
	};

	public EWMAEx1()
	{
		AxisXY axis = new AxisXY(this.Chart);
		double lambda = 0.3;
		EWMA ewma = new EWMA(axis, data, lambda);
		ewma.ControlData.MarkerColor = System.Drawing.Color.Blue;
	}

	public static void Main(string[] argv)
	{
		System.Windows.Forms.Application.Run(new EWMAEx1());
	}
}
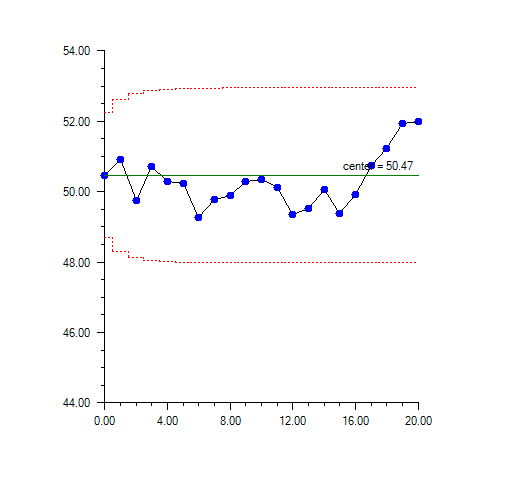
Output
Link to C# source.