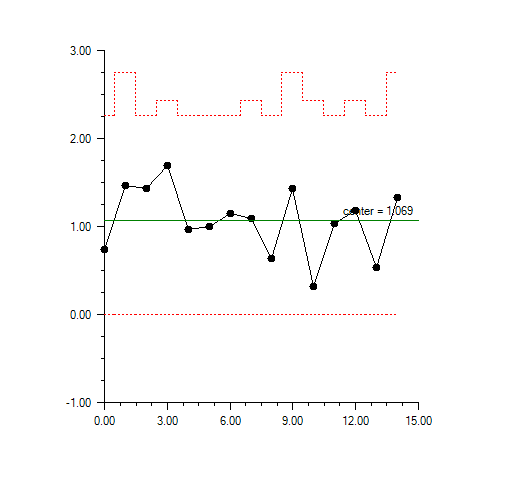
During a manufacturing process 15 samples, each containing 3 to 5 items, were measured. An R chart was contructed from the 15 sample ranges. Since the sample sizes are unequal the upper control limit is a stair step line.
using Imsl.Chart2D;
using Imsl.Chart2D.QC;
using System;

public class RChartEx1 : FrameChart
{
	static private double[][] data = {
		new double[]{44.73, 45.47, 45.39, 45.33, 45.24},
		new double[]{45.57, 46.87, 45.40},
		new double[]{46.39, 45.31, 46.74, 46.06, 45.51},
		new double[]{45.54, 46.27, 44.57, 45.36},
		new double[]{45.58, 45.59, 46.02, 45.45, 46.42},
		new double[]{45.91, 45.38, 44.98, 44.91, 45.17},
		new double[]{45.98, 45.29, 45.50, 45.77, 46.44},
		new double[]{46.30, 45.65, 45.21, 45.43},
		new double[]{45.77, 45.38, 45.65, 45.25, 45.89},
		new double[]{44.10, 45.53, 44.65},
		new double[]{45.95, 46.22, 45.92, 45.90},
		new double[]{44.87, 44.98, 45.91, 45.18, 45.64},
		new double[]{44.70, 45.89, 45.84, 45.07},
		new double[]{45.90, 45.80, 46.30, 46.34, 46.34},
		new double[]{44.90, 46.23, 45.16}
	};

	public RChartEx1()
	{
		AxisXY axis = new AxisXY(this.Chart);
		new RChart(axis, data);
	}

	public static void Main(string[] argv)
	{
		System.Windows.Forms.Application.Run(new RChartEx1());
	}
}