BAR3D Procedure
Displays a 2D grid of bars rendered three dimensionally.
Usage
BAR3D, heights
Input Parameters
heights—A 1D or 2D array of bar elevations, where heights(i,j) represents the height of the bar located at row i, column j.
Keywords
Barmin—A scalar value representing the minimum starting height of all bars. Barmin must be less then or equal to the minimum heights value, and is useful when heights values are all greater than 0 and 0 should not be included in the Z axis. By default, bars are drawn starting from a base of 0.
CenterLabels—If set and nonzero, for each column and row of bars there is a corresponding X and Y axis major tick mark which is centered with respect to each column and row.
IndividualColors—Array of the same dimensions as heights where IndividualColors(i,j) is the colortable index to associate with heights(i,j).
ColumnColors—Array of length N, where N is the number of columns in heights, where ColumnColors(i) is the colortable index to associate with the heights(*,i).
MainTitlePosition—A two element vector where MainTitlePosition(0) is X coordinate and MainTitlePosition(1) is the Y coordinate for the center of the main title, in units of a normalized coordinate system ([0,0] is the lower-left corner of the graphics window, [1,1] is the upper-right corner).
Outline—If set and nonzero, the edges of each bar are drawn in the background color (black by default).
RowColors—Array of length M, where M is the number of rows in heights, where RowColors(i) is the colortable index to associate with the heights(i,*).
Other BAR3D keywords are listed below. For a description of each keyword, see
Graphics and Plotting Keywords.
Discussion
The heights parameter is a 1D or 2D array of elevation values. The 3D effect is established by modifying the colortable to create darker color values for use on the top and left sides of the bars. By default, the bars are displayed vertically (upward).
Examples
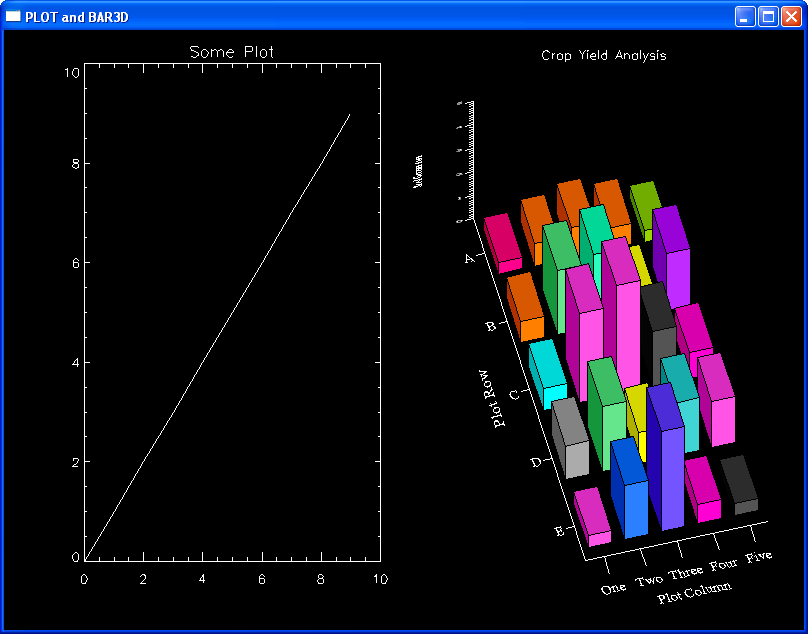
WINDOW, /Free, Xsize=800, Ysize=600, Title='PLOT and BAR3D'
!P.Multi = [0,2,0]
PLOT, INDGEN(10), Title='Some Plot'
xlabels = ['One', 'Two', 'Three', 'Four', 'Five']
ylabels = ['E', 'D', 'C', 'B', 'A']
xx = DIST(5) * RANDOMU(seed, 5, 5) * 2 + 0.5
LOADCT, 0
TEK_COLOR
; Make a 5x5 array of random colortable indices, ranging 2-31
randColors = NINT(RANDOMU(s, 5, 5)*29 + 2)
BAR3D, xx, Ax=75, Az=15, Title='Crop Yield Analysis', $
Xtitle='Plot Column', Xtickname=xlabels, Ytitle='Plot Row', $
Ytickname=ylabels, /CenterLabels, $
Ztitle='Seed Germination', Charsize=1.15, /Outline, Font=0, $
IndividualColors=randColors, Ticklen=-0.05, $
MainTitlePosition=[0.75, 0.95]
Version 2017.1
Copyright © 2019, Rogue Wave Software, Inc. All Rights Reserved.