Vertical Bar Graphs
The Vertical Bar axis types are used to plot data values as bars which extend vertically. The bars for the data objects in a group are spaced evenly across the horizontal axis.
• CX_AXIS_CLASSIC displays a numeric y-axis to the left of the graph.
• CX_AXIS_CLASSIC_RIGHT displays a numeric axis to the right.
• CX_AXIS_DATE and CX_AXIS_DATE_R are used when the data values are dates or times.
• The isographic equivalents—CX_AXIS_ISO_CLASSIC, CX_AXIS_ISO_CLASSIC_R, CX_AXIS_ISO_DATE, and CX_AXIS_ISO_DATE_R—add a pseudo three-dimensional look to the axes and bars.
The data axis (Y) is defined by an SRGDecimalScale object or SRGLogScale for logarithmic scaling or SRGDateScale for date/time values. The other axis (X) is defined by SRGIndexScale. The annotations from the data items (indices) in group 0 are used to label the axis.
The methods described above for changing the scaling and appearance of Classic axes also apply here.
These axis types are supported by:
• Vertical Bar graphs
• Extended Vertical Bar graphs
• Stacked Vertical Bar graphs
• Strata Vertical Bar graphs
• Strata Vertical Bar by Group graphs
• 100% Strata Vertical Bar graphs
• 100% Strata Vertical Bar by Group graphs
Vertical Bar Graphs
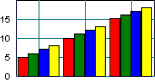
In a Vertical Bar graph, the data values are indicated by the vertical extent of individual rectangles.
The bars’ appearance is determined by the settings in the style member of the individual data items. If the interior and frame styles of a data item are set to NONE, the style of the first group is used (SRGraphDataList object).
Classic or Iso Classic Axis. One group per series.
Extended Vertical Bar Graphs
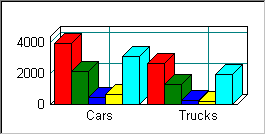
The Extended Vertical Bar style gives the bars and axes a 3-D look.
The bars’ appearance is determined by the settings in the style member of the individual data items. If the interior and frame styles of a data item are set to NONE, the style of the first group is used (SRGraphDataList object).
Classic or Iso Classic Axis. One group per series.
Stacked Vertical Bar Graphs
In a Stacked Vertical Bar graph, the bars for different groups are displayed one behind another, rather than side-by-side. The values from the different groups are not summed. The Strata Vertical Bar graph is what some users expect for a stacked bar graph.
The bars’ appearance is determined by the settings in the style member of the individual data items. If the interior and frame styles of a data item are set to NONE, the style of the first group is used (SRGraphDataList object).
Classic or Iso Classic Axis. One group per series.
Strata Vertical Bar Graphs
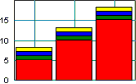
A Strata Vertical Bar graph is what others might call a stacked bar graph. It shows the summed total of a particular index over all groups. The length of the combined bar represents the total over all groups. Areas within the bar show how much each group contributes to the total. For example, a strata bar chart could be used to show the market share of individual car manufacturers (groups) over several years (indices).
Because negative values can not be represented, a standard bar chart is drawn if the data contain negative values.
The bars’ appearance is determined by the settings in the style member of the individual data items. If the interior and frame styles of a data item are set to NONE, the style of the first group is used (SRGraphDataList object).
Classic or Iso Classic Axis. One group per series. One bar per index.
Strata Vertical Bar by Group Graphs
CX_GRAPH_STRATAVBARG
This graph style reverses the roles of groups and indices from those of the previous style. A bar is drawn for each group, with segments showing the contributions of each index.
The bars’ appearance is determined by the settings in the style member of the individual data items. If the interior and frame styles of a data item are set to NONE, then the global style of this display component is used.
Classic or Iso Classic Axis. One index per series. One bar per group.
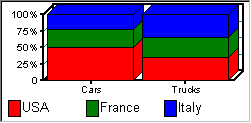
100% Strata Vertical Bar Graphs
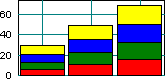
100% Strata Vertical Bar graphs are similar to Strata bar graphs, except all the combined bars have the same height. Like a Pie graph, the relative importance of the contributing factors is displayed. These graphs highlight the variation of these contributions with time or place. In this style, a bar is drawn for each index with segments showing each group’s relative contributions.
Because negative values can not be represented, a standard bar chart is drawn if the data contain negative values.
The bars’ appearance is determined by the settings in the style member of the individual data items. If the interior and frame styles of a data item are set to NONE, the style of the first group is used (SRGraphDataList object).
Classic or Iso Classic Axis. One group per series. One bar per index.
100% Strata Vertical Bar by Group Graph
CX_GRAPH_STRATAVBARG100
This graph style reverses the roles of groups and indices from those of the previous style. A bar is drawn for each group with segments showing the relative contributions of each index.
The bars’ appearance is determined by the settings in the style member of the individual data items. If the interior and frame styles of a data item are set to NONE, then the global style of this display component is used.
Classic or Iso Classic Axis. One index per series. One bar per group.