Polar Graphs
Polar graphs are like scatter graphs that use polar coordinates. The data must be arranged in group-wise pairs. The first group contains the phase (angle) data, in degrees. The second group contains magnitude information.
The polar axis (CX_AXIS_POLAR) consists of a series on concentric, labeled circles and a set of radial lines at 22.5-degree intervals, starting at 0 degrees on the vertical and increasing clockwise. This default spacing of the radial lines can be changed by a simple override of SRGraphDisplay::DrawPolarLabels() and DrawPolarAxis().
Two types of polar graphs are provided:
• Polar graph
• Area Polar graph
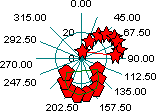
Polar Graph
The Polar graph draws a line connecting the data points. Optionally, wigets can cover the data points.
The appearance of the data line and wigets is determined by the style member of the individual data items.
Polar Axis. Two groups (phase in degrees and magnitude) per series.
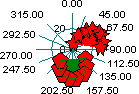
Area Polar Graph
The Area Polar graph treats the data points as vertices of a polygon that is filled according to the setting of the style member of the phase group. The vertices are covered by wigets, by default.
Polar Axis. Two groups (phase in degrees and magnitude) per series.