Web Graphs
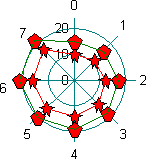
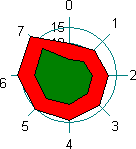
Web charts are like Line charts that use polar coordinates. The web axis (CX_AXIS_WEB) consists of a series of concentric, labeled circles and a set of radial lines—one for each data item (index) in the largest group. Each data item is represented by a point on the radial associated with its index, at a distance determined by the data value.
Two types of web graphs are provided:
• Web graph
• Area Web graph
Web Graph
The Web graph draws a line connecting the data points. Optionally, wigets can cover the data points.
The appearance of the data line and wigets is determined by the style member of the individual data items.
Web Axis. One group per series.
Area Web Graph
The Area Web graph treats the data points as vertices of a polygon that is filled according to the settings of the style member of the group. Optionally, wigets can cover the vertices.
Web Axis. One group per series.


