Scatter Graphs
The Scatter graphs plot ordered pairs of data values against appropriately scaled x and y-axes. The data points can be connected with a line. The data points can be optionally covered by wigets or point objects.
The appearance of the data line and wigets is determined by the style object of the individual data items.
Scatter graphs usually use the CX_AXIS_XYSCATTER axis type. Both axes are scaled numerically using SRGDecimalScale, SRGLogScale (if the graph is logarithmic), or SRGDateScale (for time values). If one of the axes is to be labeled with dates or times, CX_AXIS_SCATTER_DATEX and CX_AXIS_SCATTER_DATEY are available. Remove the labels on the x and y-axes by calling pD‑>GetStyle()‑>SetShowIndices(FALSE) and SetShowNumerals(FALSE), respectively.
Three Scatter graph types are provided to accept data in three different formats:
• XY Scatter-Alternating graph
• XY Scatter by Group graph
• XY Scatter by Index graph
• Extended XY Scatter graphs
XY Scatter-Alternating Graph
This graph style accepts X,Y data alternately from the data array. The first value in the scope is taken as X, the second as Y, and so on. If the number of indices in a group is uneven, the graph will treat the first entry on each alternate line as Y data, but it will always stick to the x,y, x,y format.
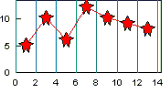
Scatter Axis. X and Y data from alternate data objects.
XY Scatter by Group Graph
This style treats even groups as X data and odd groups as Y data.
Scatter Axis. Two groups per series.
XY Scatter by Index Graph
This style takes X data from the even indices and Y data from odd indices.
Scatter Axis. Two indices per series.
Extended XY Scatter Graphs
CX_GRAPH_XYSCATTERA_EX
CX_GRAPH_XYSCATTERG_EX
CX_GRAPH_XYSCATTERI_EX
If logarithmic scaling is specified for the standard Scatter charts by calling pD‑>GetStyle()‑>SetLog(TRUE), where pD is a pointer to the display component, both axes use logarithmic scaling. The Extended graph types allow logarithmic scaling to be used on one axis with linear scaling on the other.
With these graph types,
• Call SetLog(TRUE) for a log y-axis
• Call SetLogX(TRUE) for a log x-axis
Scatter Axis. Two groups or indices per series.