Bubble Graphs
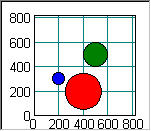
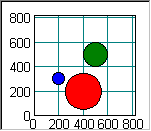
Bubble charts are XY scatter charts with a third variable that determines the relative size (radius or area) of a circle or square marking the x-y position. Bubble charts can be used to show the population or radar coverage area at various x-y positions, for example.
For simplicity, logarithmic scaling is not supported, and the data must be organized by groups. Each data series requires three groups: x-coordinate, y-coordinate, and bubble size.
As with pie charts, the appropriate legend style for bubble charts is CX_LEGEND_BY_RECTANGLE. The bubbles for all available data items are sorted together, and each bubble is individually colored. Then smaller bubbles that overlay larger bubbles can be discerned.
By default, the bubble size variable is assumed to have the same scaling (units) as the x and y coordinates. This makes geographic regions, such as radar coverage areas, easy to represent. In addition, it allows great flexibility in representing other types of variables because you are responsible for pre-scaling your raw data into x-y units. In this scaling mode, the bubbles generally appear elongated (ellipses or rectangles) according to the relative scaling factors of the x- and y-axes, unless SetUseSameXYScaleFactor(TRUE) is called. Because bubbles can be relatively large, they may be clipped by autoscaled axes unless SetObjectInsideView(TRUE) is called.
Alternate scaling can be selected by setting SetUseMaxSize(TRUE) and specifying the size of the largest bubble in screen pixels with SetMaxObjectWidth(). The size is adjusted for printing. Using this scaling, the bubbles are always circular (or square). In addition, the bubbles retain their sizes as the display is zoomed-in. SetObjectInsideView() has no effect because there is no relationship between the bubble size and the axis scales.
The data object style may be CX_OBJECT_BUBBLE (default=circle) or CX_OBJECT_BAR (square).
The following types of bubble graphs are available:
• Bubble Radius graph
• Bubble Area graph
Bubble Radius Graph
In this Bubble graph, the bubble’s radius (or half-width) is proportional to the bubble size variable.
Scatter Axis. Three groups per series.
Bubble Area Graph
In this Bubble graph, the bubble’s area is proportional to the bubble size variable.
Scatter Axis. Three groups per series.


