Using SRGraphLabel
SRGraphLabel extensively modifies the component panel drawing system to allow a rectangular panel, with a shadow and a border, to be rotated to any angle. Its text annotation is also displayed at an angle.
SRGraphLabel can display multiple line text.
Placement of Labels
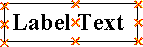
Labels do not use the component rectangle system. They maintain a floating-point coordinate pair that takes the current measurement mode into account. Any one of nine location points can serve to anchor the text.
To set the device-independent position for a label, call SRGraphLabel::SetTextPosition().
To choose one of the nine anchor points, call SRGraphLabel::SetLocationPoint() with one of the standard values. These values are enumerated in the SRGraphLabel class as shown in Table 13.
Table 13 – Standard values for anchor points
TopLeft | TopCenter | TopRight |
MidLeft | MidCenter | MidRight |
BottomLeft | BottomCenter | BottomLeft |
To rotate labels around the selected anchor point:
• Call SRGraphLabel::SetOrientation().
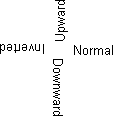
• Alternatively, call SetLabelStandard() to select one of the standard orientations. These are enumerated as Normal (0 degrees), Downward (270), Upward (90), and Inverted (180).
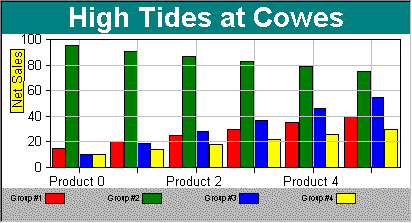
The following code illustrates how an individual label can be placed on a chart:
SRGraphLabel* pLabel = new SRGraphLabel;
pLabel->SetMeasurement(SRGraphComponent::PERCENT);
pLabel->SetLocationPoint( SRGraphLabel::TopLeft );
pLabel->SetTextPosition( 5.0, 50.0 );// in percent
pLabel->SetFontSize(10.); // points
pLabel->SetBlockMember(FALSE);
// SetAnnotation requires a parent
pLabel->SetParent(&m_Graph);
pLabel->SetAnnotation("Net Sales");
pLabel->SetLabelStandard(SRGraphLabel::Upward);
SRGraphStyle* pS=pLabel->GetStyle();
pS->SetComponentBorderStyle(CX_THICK_3D_BORDER);
pS->SetComponentFillStyle(CX_SOLID_FILL);
pS->SetColor(CXCLR_BLUE);
m_Graph.AddComponent(pLabel);
Placement of Labels in a Label Block
A label block, SRGraphLabelBlock, holds a list of SRGraphLabel objects. The common use for the label block is to place a series of labels along an axis. You would seldom create a label block for your chart application, but they are used extensively in the component drawing classes. In particular, the axis scale classes are derived from SRGraphLabelBlock. The legend also uses a label block to position its labels.
Much of the information about customizing scales in
Chapter 16, “Chart Extensions,” also applies to label blocks.
To add labels to a label block, call SRGraphLabelBlock::AddLabel() or AddLabelIndex().
To specify label positions:
• Space the labels uniformly along the line between two points by calling the SRGraphLabelBlock::SetBlockPositions(ptStart, ptEnd) function.
• Or, position them individually using the three overloaded SRGraphLabel::SetTextPosition() functions.
To set the orientation of all the labels in the block, call SRGraphLabelBlock::SetBlockOrientation(nDegrees).
The label block has the ability to prevent labels from overprinting one another. You may specify whether labels should be hidden (the default) or shifted to avoid collisions.
To enable label collision detection, call SRGraphLabelBlock::SetCheckOverlaps(TRUE).
To hide labels to avoid overprinting (default), call SetLabelStyle(CX_LABELBLOCK_HIDELABELS).
To move labels to avoid overprinting, call SetLabelStyle(CX_LABELBLOCK_MOVELABELS).
Each label holds a vector along which it can move when overprinting is detected. Normally this vector is chosen to move labels in a direction perpendicular to the line between the start and end points. However, the vector can be changed to point in any direction. The pie chart, for example, uses a set of radial vectors to arrange labels around the circumference of a pie.
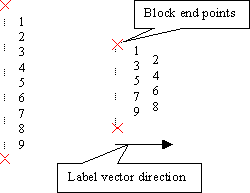
The figure below shows a label block in two states. The first state, on the left, shows the block having enough space to display all its labels in order, spaced along the line between the start and end points. The second illustration shows the block after the start and endpoints have been moved closer together. You can see how alternate labels were automatically moved in the direction of the default vector to avoid overlapping each other.
To set all the vectors in a block to point in the same direction, call SRGraphLabelBlock::SetBlockVectors().
To set the vectors for the labels individually, call one of the three overloaded SRGraphLabel::SetVector() functions.
Tick List Management
A label block can maintain a CPtrList of CPoint objects, one for each label. These CPoints are updated every time a new set of label positions is calculated. The point list is used to place grid lines or tick marks next to labels.
To activate tick list management, call SRGraphLabelBlock::SetLogTickPositions(TRUE).
To supply your own tick list for updating, call SRGraphLabelBlock::SetptrTickPositionList().