Charts
Java™ user interface developers often need to include a 2D chart as part of the overall display. This chart may need to be deployed as a desktop application and/or as Web thin client. Configuring a chart display should be easy, much like any other Swing component. However, developers need to be sure that the chart they include can be completely customized to meet their specific requirements, therefore they need an open API.
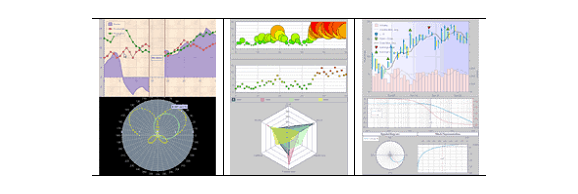
JViews Charts is ideal for this. It combines a rapid application development tool for quickly configuring a chart display, with a comprehensive Software Development Kit (SDK) for providing specialized functionality. Developers using JViews Charts to put together their displays will typically start with Designer, a point-and-click editor that defines most aspects of the look and feel. The output of Designer is a project file that is loaded into the application at run time. If further fine-tuning is required, the complete SDK is also included. With JViews Charts, user interface developers have both the ease and rapid application development that Designer offers, along with the power and flexibility of a full-featured Java™ API!