Connecting a Legend to a Chart
In this part of the example, you will see how to connect a legend to the chart that you have just created to represent the square and the square root functions (see
Using a Data Set Defined by a Script Function). You would use this same procedure for any other legend and chart you might create.
To connect a legend to a given chart, do the following:
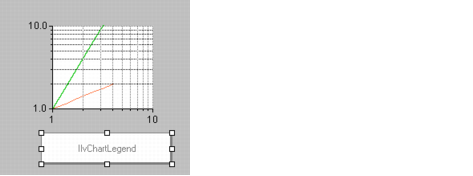
1. Drag the legend (instance of
IlvChartLegend) from the Charts palette to your working buffer window.
2. In the Name field of the Generic Inspector displayed at the bottom of the Main window, type myChartLegend to associate a name with the legend.
3. Double-click the chart to open the Chart inspector.
4. Click the Miscellaneous tab to bring this page to the front.
5. Select myChartLegend from the Legend drop-down list.
6. Click Apply to validate the change.
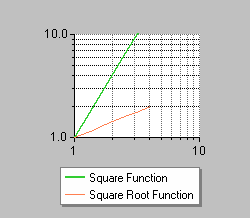
The legend is now connected to the chart. It shows two curve segments followed by the name of the data sets they represent. The name of the data sets appear because no specific text has been defined to illustrate the curves in the legend.
If you want to specify a legend text that is different from the name of the represented data set for a given curve, continue with the following steps:
7. Select the Displayers page of the Chart inspector.
8. Select each displayer and enter the text you want in the Legend field of the General subpage.
9. Click Apply to validate the changes.
This completes the example for charting analytic functions. In working through this example, you have learned how to do the following:

Use data sets defined by Script functions in your charts.
Use logarithmic scales in your charts.
Connect a legend to a chart.
Version 6.0
Copyright © 2015, Rogue Wave Software, Inc. All Rights Reserved.