Execution Tracing Package Architecture
The Execution Tracing package consists of two parts, the trace macros and the trace classes. The trace macros include:
• set declaration macros, used to declare functions as traceable and group them into class and package sets, which are toggled at runtime to determine which functions produce trace output.
• event generation macros, used to generate the trace events at the different severity levels with your trace messages
The trace classes include:
• the trace manager, a global singleton object that accepts trace events generated by the event generation macros and forwards them to the connected trace client
• trace clients, which receive trace events and process them (for example, writing the message to an ostream)
• optional trace filters, specialized clients that receive trace events and selectively forward the events to other clients, based on some criteria like the severity level
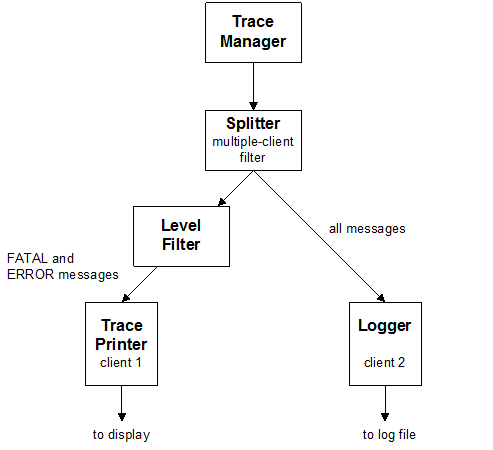
Only one client can connect directly to the trace manager. In cases where different categories of trace output must be treated differently, or some categories must be handled in multiple ways, a multi-client filter (splitter) is provided.
The Trace Output Pipeline
You can think of this pipeline for trace output as something equivalent to the flow of electrical current. The trace manager is like an electrical outlet that accepts only one plug. If you have a single appliance, you simply plug it in. If you have several appliances, you plug a power bar into the outlet and plug your appliances into the bar. In trace, a filter can work like a power bar when you need more than one client. For example, the application in
Figure 28 uses a multi-client filter as a splitter, to log all the messages and also display the important ones on the screen.
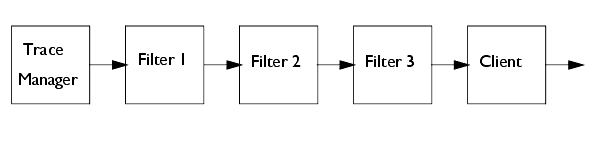
You can chain any number of filters together in the pipeline, like the series of single-client filters in
Figure 29. You could have each filter do one type of processing, for example.
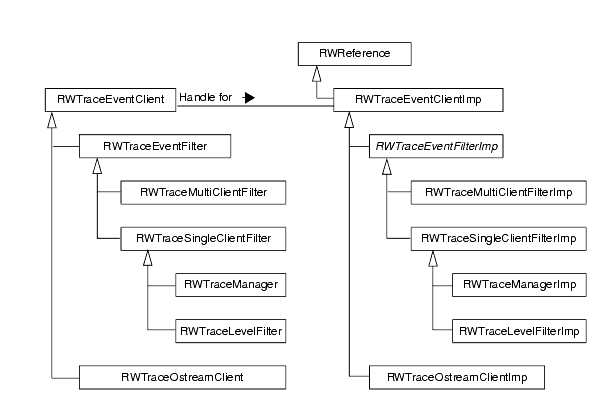
Trace Class Hierarchy
Figure 30 shows the classes in the Execution Tracing package.