Displaying Surface Views
The Surface Window
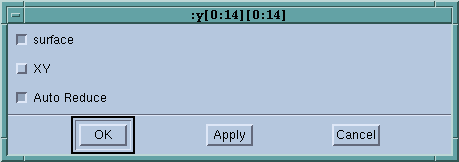
File > Options command controls surface display,
Figure 176 (A different dialog box controls Graph View.)
Options:
Surface
Displays the array’s data as a three-dimensional surface; otherwise, displays the surface as a grid.
XY
Reorients the view’s XY axes. The Z axis is perpendicular to the display.
Auto Reduce
Derives the displayed surface by averaging neighboring elements in the original dataset, in order to speed visualization by reducing surface resolution. Clear this option to accurately visualize all dataset elements.
This option supports either viewing all your data points — which takes longer to appear in the display — or viewing the data average over a number of nearby points.
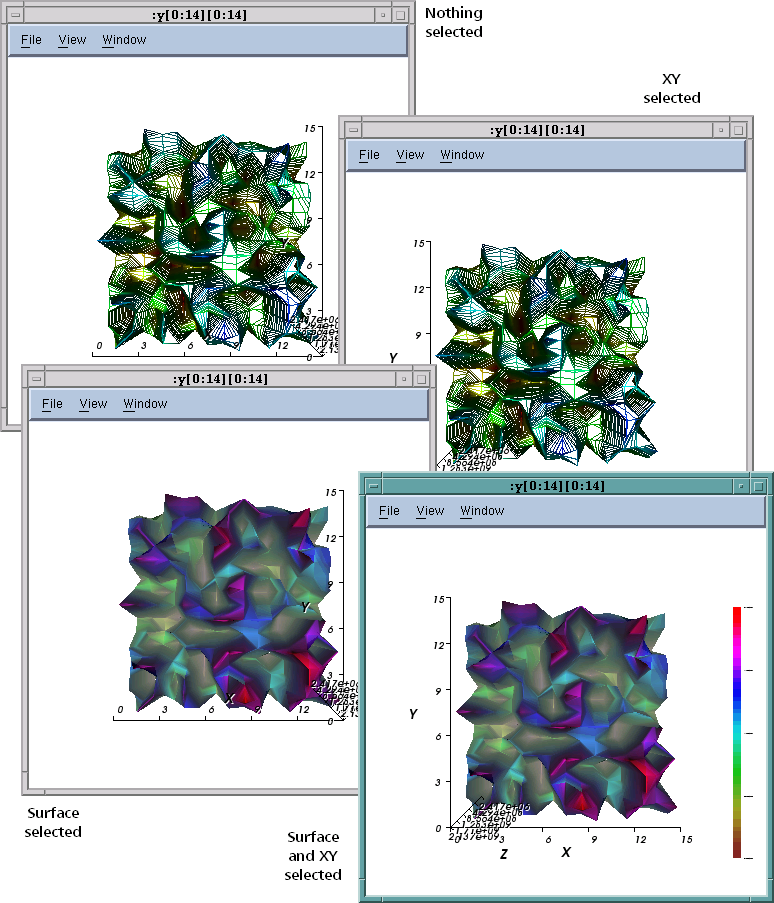
Figure 177 shows different views of the same data, based on Surface and XY options. To restore initial state of translation, rotation, and scaling options, select View > Initialize View.