Viewing Process and Thread States
Process and thread states are displayed in the following:
• The Root Window.
• The information within the File > Attach to a Running Program dialog.
• The process and thread status bars of the Process Window.
• The Threads tab of the Process Window.
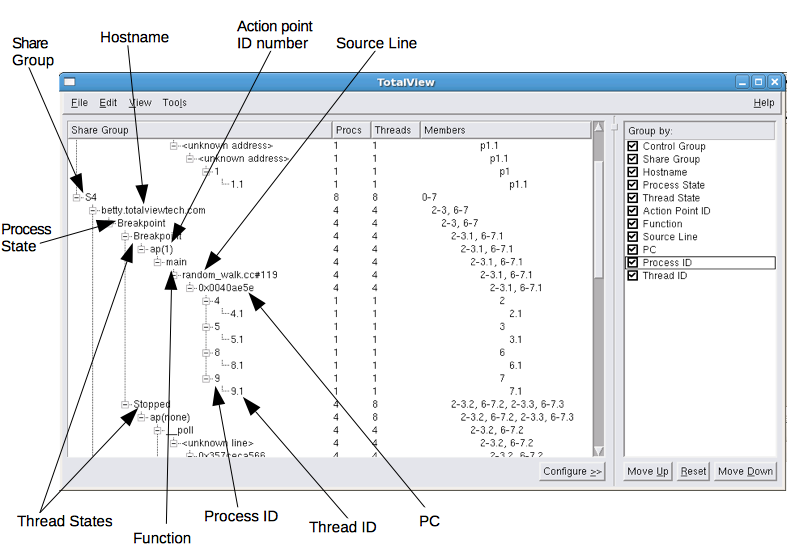
Figure 207 shows TotalView displaying process state information in the Root Window.
When you use either of these commands, TotalView also displays state information.
The
Status of a process includes the process location, the process ID, and the state of the process. (These characters are explained in
"Seeing Attached Process States".)
If you need to attach to a process that is not yet being debugged, open the File > Attach to a Running Program dialog. TotalView displays all processes associated with your username. Notice that some of the processes will be dim (drawn in a lighter font). This indicates either you cannot attach to the process or you’re already attached to it.
Notice that the status bars in the Process Window also display status information,
Figure 208.
NOTE >> If the thread ID that TotalView assigns is the same as the operating system thread ID, TotalView only displays ID. If you are debugging an MPI program, TotalView displays the thread’s rank number.