Totalview® for HPC User Guide : PART I Introduction to Debugging with TotalView : Chapter 1 About TotalView : Data Display and Visualization : Data Visualization : The Array Visualizer
The Array Visualizer
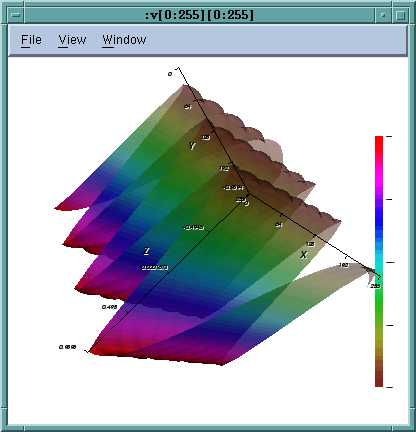
The Variable Window’s Tools > Visualize command shows a graphical representation of a multi-dimensional dataset. For instance, Figure 7 shows a sine wave in the Visualizer.
 
Figure 7 – Visualizing an Array
This helps you to quickly see outliers or other issues with your data.
 
RELATED TOPICS 
 
The Visualizer
Using the Tools > Visualize and the Tools > Visualize Distribution commands
The Visualizer Window in the in-product Help