Tools > Call Graph
Displays a window that will show a graphical representation of your program’s stack. This representation, which is called a call graph, is a dynamic representation of your program’s state.
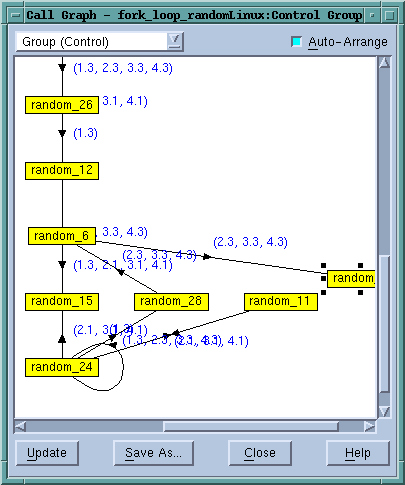
Functions and subroutines are displayed as boxes. The lines linking functions and subroutines to one another indicate that one routine was called by the other, with the arrow pointing to the called routine.
The numbers next to a link indicates the threads or ranks that called the routine. If there a great number of ranks or threads, diving on the arrow tells TotalView to display an information box listing them in a more legible format.
If you dive on the numbered list, TotalView displays a list containing all of the threads running into a routine.
Here’s what the Update and Save As buttons do:
Update
Tells TotalView to update the display. You would do this if you have asked TotalView to display a call graph while your program is executing of if you select a different item within the Group pulldown.
Save As
Tells TotalView to write the call graph to disk using the
.dot format used by such tools as Graphviz. For more information, see
http://www.graphviz.org/.
- Related Topics