TotalView Online Help
Root Window
Root Window Pages
The Root Window contains a list of all the processes and threads you are currently debugging. Diving into a process or thread by double-clicking or using the
View > Dive command opens a window for the selected process. If a window already exists for that process, TotalView brings it to the front. Each process is shown with its PID (Process ID) and a short summary of its state.
Viewing Data Hierarchically or Linearly
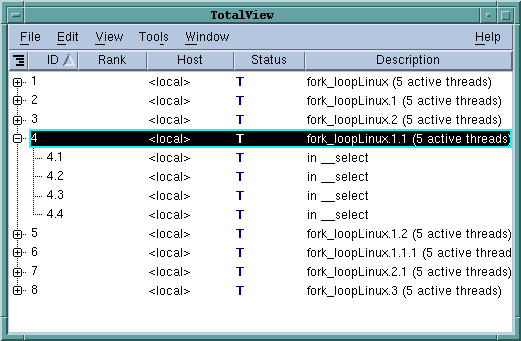
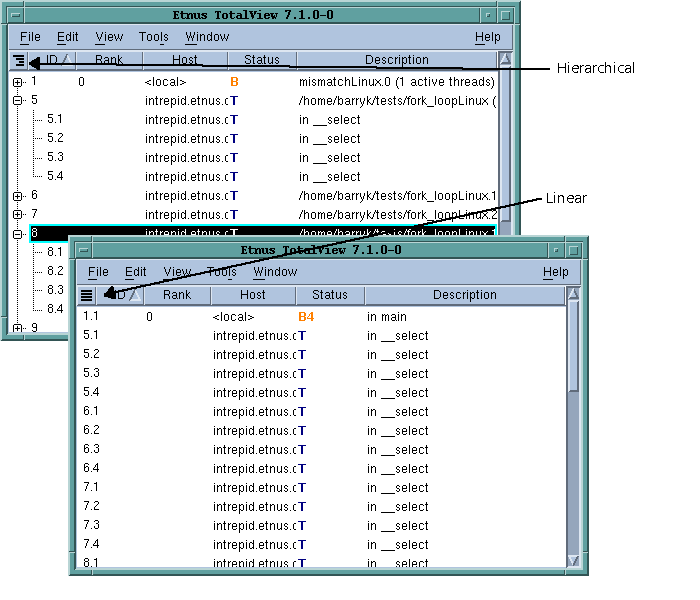
TotalView can display the Attached Page in two ways. In the preceding figure, information is shown as a “tree”. Selecting the hierarchy toggle button (

) shifts the view from a structured to l inear view. The difference between the views is that you cannot sort and aggregate the information in linear view. Sorting and aggregating is discussed later in this discussion.
When displaying data hierarchically, you can perform two operations that can’t be performed when data is displayed linearly. You can:

Selectively display information using the + or - indicators.
Sort a column by clicking on a column header.
Combining these two operations provides an easy way to see information about your program. For example, if you sort the information by clicking on the
Status header, TotalView groups each attached process by its status, for instance, if it is being held, at a breakpoint, and so on. When processes are aggregated like this, you can also display information selectively, illustrated in
Figure 2.
You can control which columns TotalView displays by right-clicking anywhere within the header line. TotalView responds by displaying a context menu listing all possible choices. If a checkbox is selected within this list, TotalView displays the column. Click on the column name within this menu to change its display status.
Viewing Remote Processes
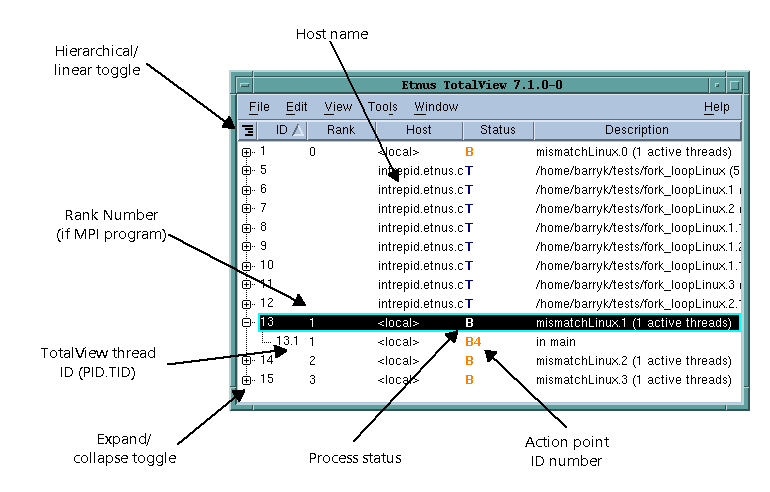
When debugging a remote process, the Root Window (and Process Window) display the host name on which the process is running. In
Figure 3, the processes are running on
intrepid and on
localhost. This figure also describes the contents of the columns in this window.
The default Attached Page has the columns of information:
Expand/collapse indicator This control lets you display or hide information. Clicking on a + indicator displays hidden information. Clicking on - hides the information by collapsing the display.
ID A TotalView-created identifier. When displaying a thread, TotalView shows it using the thread index that it created. This number is arbitrary, so don’t read anything into it.
If you dive into a process, TotalView opens (or brings to the front) a Process Window focused on an arbitrary thread. If there is no open window associated with the process, TotalView opens a window containing the first thread in the process. If you dive into a thread, TotalView displays that thread in a Process Window
TotalView does not reuse these numbers when you restart your program or when processes and threads are deleted.
Rank If you are debugging an MPI program, this column shows a process’s rank within the program.
Host The name of the computer upon which the process is executing.
Status A one-letter state indicator as follows:
Character and Meaning | Definition |
blank (Not begun) | Process only: the process has not begun running. |
Bnn (Breakpoint) | nn is the ID of the breakpoint if it is a thread. Process: one or more threads are stopped at a breakpoint. Thread: the thread is stopped at a breakpoint. If only one thread is at a breakpoint, or all threads are at the same breakpoint, TotalView displays the ID of that breakpoint for the process as well as the thread. If the process’s threads are at different breakpoints, TotalView displays a “*” for the process’s breakpoint ID. |
E (Error) | The Error state usually indicates that your program received a fatal signal from the operating system. Signals such as SIGSEGV, SIGBUS, and SIGFPE can indicate an error in your program. Process: one or more threads are in the Error state. Thread: stopped because of an error. |
H (Held) | Either you or TotalView is holding the process of a thread. Holding means that the process or thread cannot run until it is released. You can explicitly release it, or TotalView can release it if the condition that caused it to be held is satisfied. |
K (Kernel) | Thread only: the thread is executing inside the kernel (that is, it made a system call); when a thread is in the kernel, the operating system does not allow TotalView to view the thread’s full state. |
M (Mixed) | Process only: either some threads in the process are running or the process is expecting some of its threads to stop. |
R (Running) | Process: all threads in the process are running or can run. Thread: running or can run. |
T (Stopped) | Process: one or more threads are stopped, but none are in the At Breakpoint state. Thread: while the thread is stopped, it is not at a breakpoint and no error occurred. |
W (Watchpoint) | Process: one or more threads are stopped at a watchpoint. Thread: stopped at a watchpoint. |
Description Information about the process or thread. If this is a process description, TotalView displays summary and status information. If this is a thread description, it indicates the last place in which the PC was seen. This is the place where the thread was last stopped.
- Related Topics