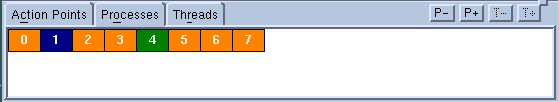
Processes/Ranks Tab
Displays a grid containing all of the processes in the current control group. If you are debugging an MPI program, TotalView displays ranks instead of processes.
The block’s color represents the state, as follows:
Color | Meaning |
Blue | Stopped; usually due to another process or thread hitting a breakpoint |
Orange | At breakpoint. |
Green | All threads in the process are running or can run. |
Red | The Error state usually indicates that your program received a fatal signal from the operating system. Signals such as SIGSEGV, SIGBUS, and SIGFPE can indicate an error in your program. |
Gray | The process has not begun running. |
Diving (clicking) on a block switches the context within the Process Window so that the Process is contained within the Process Window. If the process contains more than one thread, TotalView switches to the first worker thread. That is, it does not switch context to a manager thread.
If you select a group within the scope pulldown, which at the upper-left corner of the Process Window, TotalView dims blocks representing processes that are not within the group.