Managing Debugging Sessions
In the Sessions Manager, select the Manage Sessions button to launch the Manage Debugging Sessions dialog.
 
Figure 3: Manage Debugging Sessions
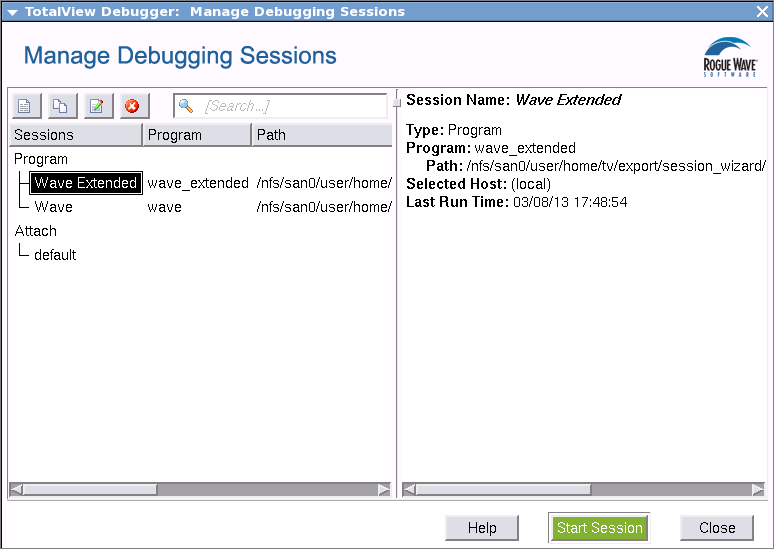
This dialog displays previously configured debugging sessions. From here, you can edit, duplicate, or delete a session, as well as view its configuration. In addition, you can start a debugging session using the green Start Session button.
You can also access the Sessions Manager via File > Manage Sessions on both the Root and Process windows.
 
Figure 4: Root Window, File > Manage Sessions
See More
*On the Sessions Manager: Managing Sessions” in the TotalView User Guide
*On additional ways to start TotalView: Starting TotalView” in the TotalView User Guide
*On command line syntax for the totalview command: TotalView Command Syntax” in the TotalView Reference Guide
*On compiling your program for debugging: “Compiling Programs” in the TotalView User Guide
*On loading a program into TotalView using either the GUI or the CLI: Loading Programs from the Sessions Manager” in the TotalView User Guide
*On attaching an existing process: Attaching to a Running Program” in the TotalView User Guide
*On debugging a core file: Debugging a Core File” in the TotalView User Guide
*On starting a parallel debugging job: Starting MPI Programs Using File > Debug New Parallel Program” in the TotalView User Guide