Using the Root Window
The Root Window appears when you start TotalView.

If you type a program name immediately after the
totalview command, TotalView also opens a Process Window with the program’s source code.
If you do not enter a program name when starting TotalView, TotalView displays its
File > New Debugging Session dialog box. Use this dialog box to select the type of debug session you wish to configure.
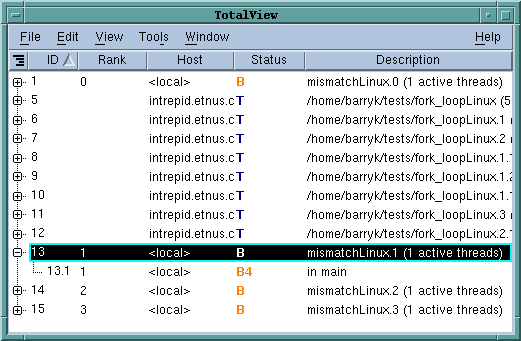
The Root Window displays a list of all the processes and threads being debugged. Before your program begins executing, the Root Window contains only the name of the program being debugged. As your program creates processes and threads, they are added to this list. Associated with each is a name, location (if a remote process), process ID, status, and a list of executing threads for each process. It also shows the thread ID, status, and the routine being executed in each thread.
Figure 62 shows the Root Window for an executing multi-threaded multi-process program.
Viewing Remote Processes
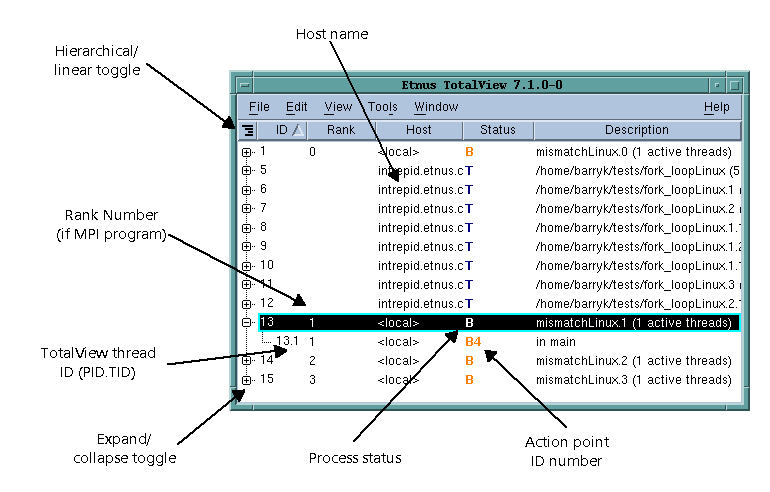
When debugging a remote process, the Root Window (and Process Window) display the host name on which the process is running. In
Figure 63, the processes are running on
intrepid and on
localhost. This figure also describes the contents of the columns in this window.
When you dive on a line in this window, its source is displayed in a Process Window.
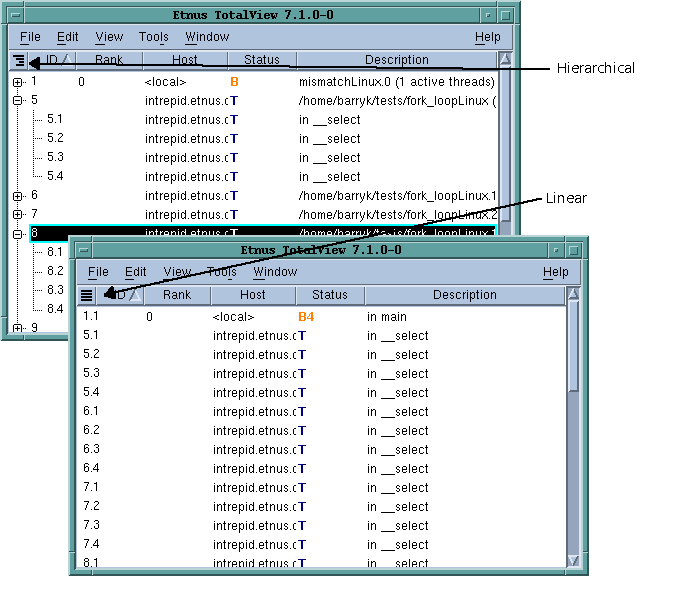
Viewing Data Linearly or Hierarchically
Select the hierarchy toggle button (

) to change the view from linear to hierarchical,
Figure 64.
When data is displayed hierarchically, you can perform the following additional operations:
Selectively display information using the
+ or
- indicators. The
View > Expand All and
View > Compress All commands open and close all of this window’s hierarchies.
Sort a column by clicking on a column header.
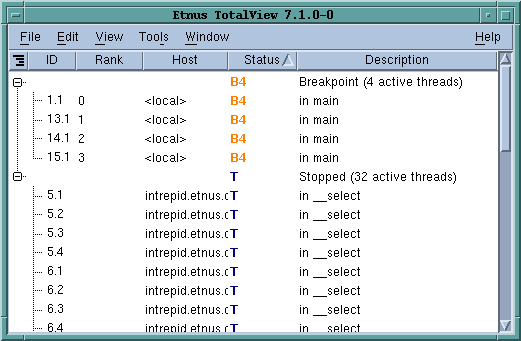
The hierarchical view can also group similar information. For example, if you sort the information by clicking the Status header, all attached processes are grouped by their status. This lets you see, for example, which threads are held, at a breakpoint, and so on. When information is aggregated (that is grouped) like this, you can also display information selectively.
Controlling the Display of Processes and Threads
TotalView displays all of your program’s processes and threads. You can change this using the following commands:
View > Display Managers: When multi-process and multi-threaded programs run, the operating system often creates threads whose sole function is to manage your program’s processes. In addition, many HPC programs use a starter process. Usually, you are not interested in these threads and processes. Using this command, you can remove them from the display, usually desirable as you will not be debugging these processes or threads.

If you are running TotalView Team, a manager process uses a token in exactly the same way as does a user process. For example, if you are running a 32 process MPI job that is invoked using mpirun, you will need 33 tokens.
View > Display Exited Threads: Tracking when processes stop and start executing in a multi-process, multi-threaded enviroment can be challenging. This command displays threads after they’ve exited. While this clutters your display with information about threads that are no longer executing, it can sometimes be helpful in tracking problems.