View Process and Thread State
You can quickly view process and thread state in both the Root Window and the Process Window. (You can also view the state of
all processes and threads in a parallel job using the
“The Parallel Backtrace View”.)
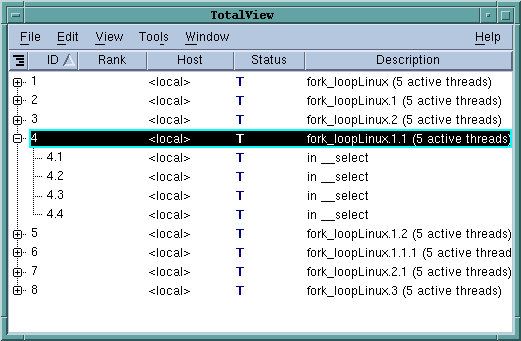
The Root Window contains an overview of all processes and threads being debugged, along with their process state (i.e. stopped, running, at breakpoint, etc.). You can dive on a process or a thread listed in the Root Window to quickly see detailed information.
The Process Window’s Thread and Process tabs also display each thread and process and its state. You can switch between running processes or threads just by clicking on them in the Process or Thread tab to change the context.
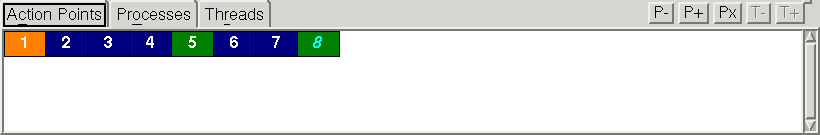
The Process tab below shows eight processes, with various states:
Blue designates that the process has stopped, usually due to another process or thread hitting a breakpoint. Orange is at a breakpoint. Green means that all threads in the process are either running or can run. Red (not pictured here) is an error state, while gray (also not pictured) would mean that the process has not yet begun to run.