-
- All Implemented Interfaces:
- Serializable, Cloneable
public class XmR
extends ShewhartControlChart
XmRis an XmR chart for monitoring a process using moving ranges.The moving range control chart uses the moving range of two successive observations to measure the process variability. This control chart is used for individual measurements (sample size = 1). The moving range is defined to be
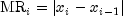 .
The control limits are at
.
The control limits are at
where
 is the mean of all of the individual observations,
 is the mean of the moving averages,
and k is the value of the "ControlLimit" attribute for the line.
Additionally,
is the mean of the moving averages,
and k is the value of the "ControlLimit" attribute for the line.
Additionally,
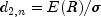 where R is the range of a Gaussian distribution.
Therefore
where R is the range of a Gaussian distribution.
Therefore  is an estimate of the standard deviation.
By default, the chart contains
an upper control limit line with k=3,
a lower control limit line with k=-3,
and a central line equal to
is an estimate of the standard deviation.
By default, the chart contains
an upper control limit line with k=3,
a lower control limit line with k=-3,
and a central line equal to  .
Additionally control limits can be added.
The method
.
Additionally control limits can be added.
The method addWecoadds control limits with k = -2, -1, 1, 2.
-
-
Field Summary
-
Fields inherited from class com.imsl.chart.qc.ShewhartControlChart
d2, d3
-
Fields inherited from class com.imsl.chart.ChartNode
AXIS_X_TOP, AXIS_Y_RIGHT, BAR_TYPE_HORIZONTAL, BAR_TYPE_VERTICAL, DASH_PATTERN_DASH, DASH_PATTERN_DASH_DOT, DASH_PATTERN_DOT, DASH_PATTERN_SOLID, DATA_TYPE_FILL, DATA_TYPE_LINE, DATA_TYPE_MARKER, DATA_TYPE_PICTURE, DATA_TYPE_TUBE, DENDROGRAM_TYPE_HORIZONTAL, DENDROGRAM_TYPE_VERTICAL, FILL_TYPE_GRADIENT, FILL_TYPE_NONE, FILL_TYPE_PAINT, FILL_TYPE_SOLID, LABEL_TYPE_PERCENT, MARKER_TYPE_ASTERISK, MARKER_TYPE_CIRCLE_CIRCLE, MARKER_TYPE_CIRCLE_PLUS, MARKER_TYPE_CIRCLE_X, MARKER_TYPE_DIAMOND_PLUS, MARKER_TYPE_FILLED_CIRCLE, MARKER_TYPE_FILLED_DIAMOND, MARKER_TYPE_FILLED_SQUARE, MARKER_TYPE_FILLED_TRIANGLE, MARKER_TYPE_HOLLOW_CIRCLE, MARKER_TYPE_HOLLOW_DIAMOND, MARKER_TYPE_HOLLOW_SQUARE, MARKER_TYPE_HOLLOW_TRIANGLE, MARKER_TYPE_OCTAGON_PLUS, MARKER_TYPE_OCTAGON_X, MARKER_TYPE_PLUS, MARKER_TYPE_SQUARE_PLUS, MARKER_TYPE_SQUARE_X, MARKER_TYPE_X, TEXT_X_CENTER, TEXT_X_LEFT, TEXT_X_RIGHT, TEXT_Y_BOTTOM, TEXT_Y_CENTER, TEXT_Y_TOP
-
Fields inherited from class com.imsl.chart.AbstractChartNode
AUTOSCALE_DATA, AUTOSCALE_DENSITY, AUTOSCALE_NUMBER, AUTOSCALE_OFF, AUTOSCALE_WINDOW, AXIS_X, AXIS_Y, AXIS_Z, LABEL_TYPE_NONE, LABEL_TYPE_TITLE, LABEL_TYPE_X, LABEL_TYPE_Y, LABEL_TYPE_Z, TRANSFORM_CUSTOM, TRANSFORM_LINEAR, TRANSFORM_LOG
-
-
Constructor Summary
Constructors Constructor and Description XmR(AxisXY axis, double[] x)Creates anXmRchart given sample data.
-
Method Summary
Methods Modifier and Type Method and Description doublegetMRBar()Returns the expected mean of of all of the moving ranges of two observations.voidprePaint()Setup chart with current settings.voidsetMRBar(double mrBar)Sets the expected mean of all of the moving ranges of two observations.-
Methods inherited from class com.imsl.chart.qc.ShewhartControlChart
addCenterLine, addControlLimit, addLowerControlLimit, addUpperControlLimit, addWecoLimits, dataRange, getCenter, getCenterLine, getControlData, getLowerControlLimit, getMeanSampleSize, getSampleSize, getUpperControlLimit, paint, removeControlLimit, setCenter, setData, setData, setSampleSize, setSampleSize, setX
-
Methods inherited from class com.imsl.chart.Data
formatLabel
-
Methods inherited from class com.imsl.chart.ChartNode
addPickListener, firePickListeners, getALT, getAxis, getBackground, getBarGap, getBarType, getBarWidth, getChart, getChartTitle, getChildren, getClipData, getComponent, getConcatenatedViewport, getDataType, getDoubleBuffering, getExplode, getFillOutlineColor, getFillOutlineType, getFillPaint, getFillType, getGradient, getHREF, getLegend, getLineDashPattern, getMarkerDashPattern, getMarkerThickness, getMarkerType, getParent, getReference, getScreenAxis, getScreenSize, getScreenViewport, getSize, getSkipWeekends, getTextAngle, getTextColor, getTitle, getToolTip, getViewport, isBitSet, removePickListener, setALT, setBarGap, setBarType, setBarWidth, setChartTitle, setClipData, setCustomTransform, setDataType, setDoubleBuffering, setExplode, setFillOutlineColor, setFillOutlineColor, setFillOutlineType, setFillPaint, setFillPaint, setFillPaint, setFillType, setGradient, setGradient, setGradient, setHREF, setImage, setLineDashPattern, setMarkerDashPattern, setMarkerThickness, setMarkerType, setReference, setScreenSize, setSize, setSkipWeekends, setTextAngle, setTextColor, setTextColor, setTitle, setTitle, setToolTip, setViewport, setViewport
-
Methods inherited from class com.imsl.chart.AbstractChartNode
clone, clone, clone, clone, getAbstractParent, getAttribute, getAutoscaleInput, getAutoscaleMinimumTimeInterval, getAutoscaleOutput, getBooleanAttribute, getChildList, getColorAttribute, getCustomTransform, getDensity, getDoubleAttribute, getFillColor, getFont, getFontName, getFontSize, getFontStyle, getImage, getIntegerAttribute, getLabelType, getLightColor, getLineColor, getLineWidth, getLocale, getMarkerColor, getMarkerSize, getName, getNumber, getPaint, getStringAttribute, getTextFormat, getTickLength, getTransform, getX, getY, isAncestorOf, isAttributeSet, isAttributeSetAtThisNode, parseColor, remove, setAttribute, setAutoscaleInput, setAutoscaleMinimumTimeInterval, setAutoscaleOutput, setDensity, setFillColor, setFillColor, setFont, setFontName, setFontSize, setFontStyle, setImage, setLabelType, setLightColor, setLightColor, setLineColor, setLineColor, setLineWidth, setLocale, setMarkerColor, setMarkerColor, setMarkerSize, setName, setNumber, setPaint, setTextFormat, setTextFormat, setTickLength, setTransform, setX, setY, toString
-
-
-
-
Constructor Detail
-
XmR
public XmR(AxisXY axis,
   double[] x)
Creates anXmRchart given sample data.- Parameters:
axis- theAxisXYparent of this nodex- is an array containing sample data.
-
-
Method Detail
-
getMRBar
public double getMRBar()
Returns the expected mean of of all of the moving ranges of two observations.- Returns:
- the expected mean of the moving ranges.
-
prePaint
public void prePaint()
Setup chart with current settings.
-
setMRBar
public void setMRBar(double mrBar)
Sets the expected mean of all of the moving ranges of two observations. This defaults to the mean of the moving ranges computed by the constructor from the data. Its default value is the computed from the data passed to the constructor.- Parameters:
mrBar- is the expected mean of the moving ranges.
-
-