LACK_OF_FIT Function (PV-WAVE Advantage)
Performs lack-of-fit test for a univariate time series or transfer function given the appropriate correlation function.
Usage
result = LACK_OF_FIT(nobs, cf, npfree)
Input Parameters
nobs—Number of observations of the stationary time series.
cf—One-dimensional array containing the correlation function.
npfree—Number of free parameters in the formulation of the time series model. npfree must be greater than or equal to zero and less than lagmax where lagmax = (N_ELEMENTS(cf) – 1). Woodfield (1990) recommends npfree = p + q.
Returned Value
result—One-dimensional array of length 2 with the test statistic, Q, and its
p-value, p. Under the null hypothesis, Q has an approximate chi-squared distribution with lagmax - Lagmin + 1 – npfree degrees of freedom.
Input Keywords
Double—If present and nonzero, double precision is used.
Lagmin—Minimum lag of the correlation function. Lagmin corresponds to the lower bound of summation in the lack of fit test statistic. Default: Lagmin = 1.
Discussion
Routine LACK_OF_FIT may be used to diagnose lack of fit in both ARMA and transfer function models.
Max, Min, and Free Arguments shows typical arguments for these situations:
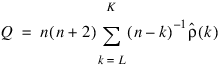
Function LACK_OF_FIT performs a portmanteau lack of fit test for a time series or transfer function containing n observations given the appropriate sample correlation function:
for k = L, L + 1, …, K where L = Lagmin and K = lagmax.
The basic form of the test statistic Q is:
with L = 1 if:
is an autocorrelation function. Given that the model is adequate, Q has a chi-squared distribution with K − L + 1 – m degrees of freedom where m = npfree is the number of parameters estimated in the model. If the mean of the time series is estimated, Woodfield (1990) recommends not including this in the count of the parameters estimated in the model. Thus, for an ARMA(p, q) model set npfree = p + q regardless of whether the mean is estimated or not. The original derivation for time series models is due to Box and Pierce (1970) with the above modified version discussed by Ljung and Box (1978). The extension of the test to transfer function models is discussed by Box and Jenkins (1976, pages 394–395).
Example
Consider the Wölfer Sunspot Data (Anderson 1971, page 660) consisting of the number of sunspots observed each year from 1749 through 1924. The data set for this example consists of the number of sunspots observed from 1770 through 1869. An ARMA(2,1) with nonzero mean is fitted using the
ARMA Function (PV-WAVE Advantage). The autocorrelations of the residuals are estimated using the
AUTOCORRELATION Function (PV-WAVE Advantage). A portmanteau lack of fit test is computed using 10 lags with LACK_OF_FIT.
The warning message from ARMA in the output can be ignored. (See the example for routine ARMA for a full explanation of the warning message.)
p = 2
q = 1
tc = 0.125
lagmax = 10
npfree = 4
; Get sunspot data for 1770 through 1869, store it in x()
data = STATDATA(2)
x = data(21:120,1)
; Get residuals for ARMA(2, 1) for autocorrelation/lack of fit
params = ARMA(x, p, q, /Lsq, Tol_Convergence = tc, Residual = r)
; % ARMA: Warning: STAT_LEAST_SQUARES_FAILED
; Least squares estimation of the parameters has failed to
; converge. Increase 'LGTH_BACKCAST' and/or 'TOL_BACKCAST' and/
; or 'TOL_CONVERGENCE'. The estimates of the parameters at the
; last iteration may be used as new starting values.
; Get autocorrelations from residuals for lack of fit test
; NOTE: number of observations is equal to number of residuals
corrs = AUTOCORRELATION(r, lagmax)
; Get lack of fit test statistic and p-value
; NOTE: number of observations is equal to original number of data
result = LACK_OF_FIT(N_ELEMENTS(x), corrs, npfree)
; Print parameter estimates, test statistic, and p_value
; NOTE: Test Statistic Q follows a Chi-squated dist.
PRINT, 'Lack of Fit Statistic (Q) =', result(0), $
Format = '(A28, F8.3)'
; PV-WAVE prints: Lack of Fit Statistic (Q) = 14.598
PRINT, 'P-value (PVALUE) =', result(1), Format = '(A28, F8.4)'
; PV-WAVE prints: P-value (PVALUE) = 0.9764
Version 2017.0
Copyright © 2017, Rogue Wave Software, Inc. All Rights Reserved.