REFLINES Procedure (PV-WAVE Extreme Advantage)
Produces reference lines on a frequency response graph.
Usage
REFLINES, x
Input Parameters
x—A one-dimensional array of the frequencies on the x-axis where reference lines are to be drawn.
Keywords
None.
Discussion
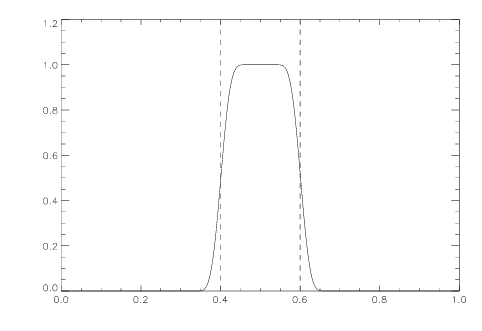
REFLINES is particularly useful for displaying cutoff frequencies on an existing frequency response plot. For each value in the input array, one vertical line is drawn from the x-axis to the maximum y value. The lines are drawn in color 55, which is dependent on the currently loaded color table.
Example
In this example, a single bandpass filter is plotted, and the band edges are drawn using REFLINES. The results are shown in
Figure 4-5: Reference Lines Indicating Edge Frequencies of Bandpass Filter on page 192.
; Approximate an ideal bandpass filter with normalized band
; edges at 0.4 and 0.6 using a Blackman window.
h = FIRDESIGN(FIRWIN(101, /Blackman), 0.4, 0.6, /Bandpass)
hf = FREQRESP_Z(h, Outfreq = f)
; Plot the magnitude of the frequency response.
PLOT, f, ABS(hf)
; Load 16 level color table so the reference lines appear green.
LOADCT, 12
; Draw reference lines at the band edge frequencies.
REFLINES, [0.4, 0.6]
Version 2017.0
Copyright © 2017, Rogue Wave Software, Inc. All Rights Reserved.