Industry Applications
The INDUSTRY APPLICATIONS menu demonstrate specific examples of how some industries can benefit from PV-WAVE.
Financial Analysis
The modules in this application show how PV-WAVE can be applied to financial analysis.

Efficient Frontier
Loan Mortgage Analysis
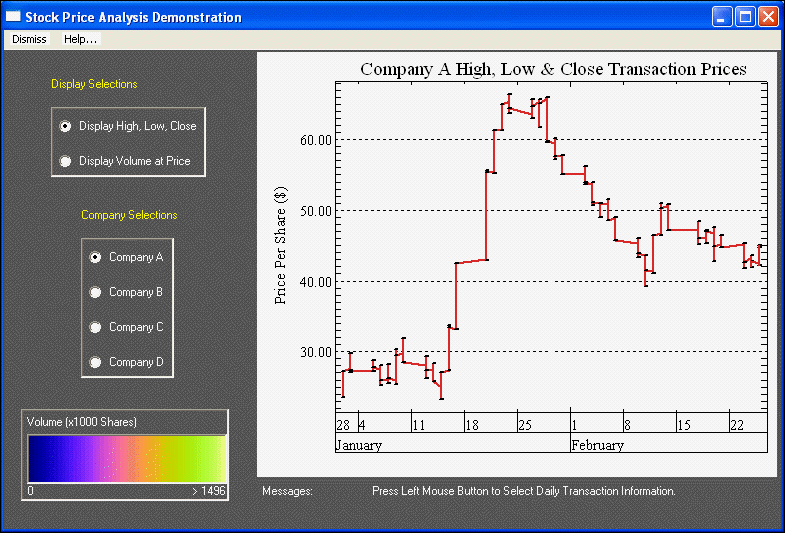
Stock Price Analysis
Option Pricing Analysis
Knockout Option Analysis
Kalman Filtering
Wavelet
Time Series Forecasting
Time Series Forecasting includes the following:
Auto ARIMA
Neural Networks
Auto ARIMA
This demo uses the Auto ARIMA functionality for time series model fitting and forecasting, comparing AR, ARMA, and ARIMA models with both nonseasonal and seasonal differencing. It allows the user to specify p, d and q values as inputs to the model, allows for outlier identification, and displays the numerical and graphical results of the fit and forecast.
Neural Newtorks
This module illustrates how to forecast time series using a feed-forward neural network trained on historical data. Three data sets are used for demonstration purposes: champagne sales per month, sun spot frequency per year, and the price of crude oil. The forecast is compared to observed values and also an ARMA(2,1) model.
Test Engineering
This module displays multi-variate engine test data consisting of over 20,000 floating point values. This module shows an interface where various relationships between selected variables can be displayed using strip charts and raster images.
The concepts demonstrated include:
Animation of a sequence of images
Calculation and display of relationships between multiple variables
Multiple strip charts
Display of floating-point data as raster images
Medical Imaging
Medical imaging includes the following:
MRI Scan
PET Scan
Heartbeat Animation
MRI Scan
A 3D MRI (Magnetic Resonance Imaging) scan of a human head is rendered as a cut-away volume and a series of volume rendered images displayed from different viewpoints. You may interactively define a slicing plane and extract an oblique slice from the volumetric data.
The concepts demonstrated include:
Overlaying vector graphics and text on a raster image
Animation of a sequence of contour plots
Reading in 3D volumetric data
Slicing 3D volumetric data
Volume rendering and animation of 3D data
PET Scan
This Gallery application module first displays images of a normal brain and a concussion damaged brain. The data for these images was generated using a medical technique called PET (Positron Emission Topography). The scientists compare the rate of glucose absorption in healthy tissue, compared to the sample.
Heartbeat Animation
Next, an animation sequence of an abnormal heartbeat is displayed as a series of images and contours. This data was collected using an ultrasound device which scanned a horse’s heart.
Oil Gas Exploration
This demonstration shows how PV-WAVE can be used to analyze well log information. You may display:
the actual well log for a specific well
the well paths colored by a selected variable
an image showing the location of the underground reservoir
Earth Sciences
Several plots of global wind velocity data are shown in this demonstration.
The concepts include:
EPA Time Series Pollution
EPA Windrose
World-Wide Wind Currents
Fluid Particle Tracking
CFD Aerodynamics
PV-WAVE’s abilities for displaying and analyzing computational fluid dynamic (CFD) data are shown in this demonstration.
The concepts include:
Airfoil Analysis
Turbine Flow Analysis
Signal Processing
This application demonstrates some of the ways PV-WAVE can be used to manipulate and display signal data. X-Y plots can be combined with filters built into PV-WAVE or developed using the PV-WAVE language. The data is a sample signal of a voice saying “PV-WAVE”. In the plotted waveform you can see the “P”, the “V” and “WAVE” as three distinct bursts.
The raster image of the spectrogram displays the frequencies present in the original voice signal.
The concepts demonstrated include:
Filtering and displaying the signal
Use of FFT’s to calculate the spectrogram of a signal
note | This demonstration does not use the Signal Processing toolkit. Only the base PV-WAVE language is required. |
Image Processing
This demonstration shows how PV-WAVE can be used to perform many common image processing filtering and analysis functions. Interactive tools for plotting profiles, zooming in on particular regions, plotting histograms, and manipulating color palettes are available. Many common spatial and frequency domain filters are available as well as geometric transformations and image comparisons.
note | This demonstration does not use the Image Processing toolkit. Only the base PV-WAVE language is required. |
Version 2017.1
Copyright © 2019, Rogue Wave Software, Inc. All Rights Reserved.