Image Data Example
The next dataset to experiment with consists of an image of a flame obtained with an imaging device. This dataset is a 128-by-128 2D array. The data is 8-bit binary, and thus has values ranging from 0 to 255.
We have purposely given you a dataset that contains a poor image so that you can see how easy it is to use the Navigator to enhance the image.
1. If it is not already running, start PV‑WAVE. (See
"Starting PV‑WAVE" if you need detailed instructions.)
2. If it is not already running, start the Navigator by typing navigator at the WAVE> prompt.
Importing 8-bit Image Data
Because the data type for this 8-bit data is byte, you do not import the data with the WzPreview Tool, as you did in the previous example. (Remember that the WzPreview Tool is designed for importing ASCII data.) For this type of data, you need to use the WzImport Tool.
1. Click the WzImport icon in the Navigator window. The WzImport Tool appears.
2. From the File Type option menu of the WzImport Tool, select 8 Bit Image.
3. In the File Name text field, type the full path and file name of the image data file, as follows:
(UNIX) <wavedir>/data/flame.img
Where <wavedir> is the main PV-WAVE directory. This is the directory where PV‑WAVE was installed. If you aren’t sure which directory this is, see your system administrator.
4. Select the Read button. A message appears in the message area indicating that the variable IMG8 has been created.
5. Close the WzImport Tool. (Select File=>Close.)
Checking the Selected Variables List
To display a variable in a graphical VDA Tool, such as WzImage, the variable must be “selected”. One way to select a variable is to open the WzVariable Tool and click on the variable name in the list box. That was how you selected variables in the previous lesson.
Anytime you import data into a variable using WzImport, the newly created variable is automatically “selected”. In other words, you do not have to bring up WzVariable now (unless you want to).
You can always determine which variable is the currently selected variable, by doing the following:

Choose
Tool=>List Selected Variables from the Navigator window menu. The currently selected variable or variables are then listed in the message area of the Navigator window. In this case, the variable
IMG8, the variable you just read in, is listed there.
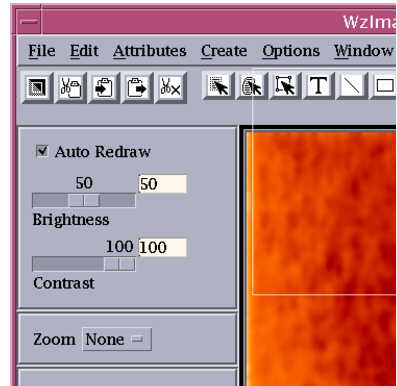
Displaying the Image
Because the image variable is already selected, all you need to do is click the
WzImage icon in the Navigator window. The WzImage Tool appears as shown in
Table C-10: WzImage Tool Displaying 8 Bit Image on page 247.
The image is displayed in the WzImage Tool.
Note that the displayed image doesn’t look very distinctive and is small compared with the available view area. That is because it is 128 x 128 pixels, while the view area can display a much larger area.
Displaying the Image as a 3D Surface Plot
1. To display the image as a 3D surface plot, click the
WzSurface icon in the Navigator window. A 3D mesh surface of the flame is displayed in the WzSurface Tool, as shown in
3D Mesh Surface of the Image.
You can also see that the edge of the surface contains spurious data, shown as a cliff. This has an undesirable effect on the display of the image since contrast in the image is scaled from the lowest to the highest valued point. It’s like accidentally getting the sun in a photograph, which over-saturates the image. A little later you’ll use PV‑WAVE commands to remove this meaningless data.
2. Close the WzSurface Tool.
Using Color
Now try looking at the image of the flame with a different set of colors.
1. Click the WzColorEdit icon on the Navigator window. The WzColorEdit Tool appears.
2. If necessary, move the windows around so that you can see both the WzImage Tool and WzColorEdit tool.
3. In the WzColorEdit Tool, select ColorTable=>System. The System Colortables list box appears.
4. To use color more effectively, select the RED TEMPERATURE colortable and click Dismiss. You will see the image in shades of red. It’s still a poor quality image; however, the next few steps will improve it.
5. Close the WzColorEdit Tool. (For now, do not close the WzImage Tool. It will be interesting to compare this original image with the enhanced image you will create later)
Rescaling Image Data
You can eliminate much of the undesirable effect of the zeros at the edge of the image by using the PV‑WAVE BYTSCL function.
BYTSCL scales your data so that all values below the specified minimum are scaled to 0, and all points with values above the specified maximum are scaled to the new maximum. When the resulting data is displayed, it scales all the points to values ranging from 0 to 255.
In the flame image, all real points fall between 200 and 255. By selecting 200 as a minimum, you set the spurious edge data to the same values as the darkest part of the flame. This will result in a marked improvement in image contrast, so go ahead and make the change.
1. Enter the following command at the WAVE> prompt:
WAVE> FLAME1 = BYTSCL(IMG8, Min=200)
The variable FLAME1 is the byte-scaled data with the effects of the zeros along the edge removed. You will now select and view the data as an image to see the improvement.
Instead of using the Navigator, let’s see how a VDA Tool can be started directly from the command line. All VDA Tools can be started in this manner, without going through the Navigator.
2. At the WAVE> prompt, enter the following command:
WzImage, FLAME1
Resizing the Image
Use the REBIN function to increase the size of the image.
1. Enter the following command at the WAVE> prompt:
WAVE> FLAME2 = REBIN(FLAME1, 512, 512)
2. Open the WzVariable Tool.
3. In the WzVariable Tool list, select the variable FLAME2.
4. Select File=>Export Variables from the WzVariable Tool menu bar. The Export Variables dialog box appears.
5. Select FLAME2 in the upper list box of the dialog box and WzImage_1 in the lower one.
6. Click the OK button in the Export Variables dialog box.
The image now is much larger and fills the view area. As a result of resampling, the image has a blotchy appearance. Next, you will smooth the image.
Smoothing the Image
The smoothing algorithm works by changing the values based on nearby values. The PV‑WAVE SMOOTH command takes a width parameter, which should be chosen as small as possible to still provide adequate smoothing. The larger the value of width, the more nearby values are considered in the smoothing algorithm. The effect is greater smoothing at the risk of losing detail. With this data, a good value to use for width is 7.
1. Enter the following command at the WAVE> prompt:
WAVE> FLAME2 = SMOOTH(FLAME2, 7)
The image is noticeably smoother. If you like, experiment with different values of width.
Cropping the Image
Even though the spurious edge data is no longer affecting the quality of the flame image, you may want to remove this data by cropping the image. To crop an image, you will use the Data Selection function.
1. Click the Data Selection button on the button bar of the WzImage Tool or choose Edit=>Data Select.
3. Select File=>Export Selected Data in the WzImage Tool. The Export Selected Data dialog box appears. This dialog box contains two list boxes. The first list box contains the name of a variable that was created to hold the subsetted data. The second list box contains the names of the VDA Tools that are currently open.
4. Select the variable name FLAME2_SUB in the first list box, and select WzImage_1 in the second list box.
5. Click OK. The subsetted variable is exported back to the original WzImage Tool. The exported variable is automatically displayed in the WzImage Tool.
Notice how cropping the image affects its appearance as shown in
Table C-16: Cropped Image on page 255.
Creating an Inverted Image
You can create an inverted image by subtracting the value of each element in the variable from 255.
note | The number 255 is used because the data was byte scaled into the range 0-255. If, for example, the data was in the range 0-127, then inversion would be achieved by subtracting your data from 127, and so on. |
1. Enter the following command at the WAVE> prompt:
WAVE> FLAME3 = 255 - FLAME2_SUB
2. In the WzVariable Tool, select Options=>Redisplay List. The FLAME3 variable appears in the list.
3. In the WzVariable Tool list, select the variable FLAME3.
4. Select File=>Export Variables from the WzVariable Tool menu bar.
5. Select FLAME3 in the upper list box and WzImage_1 in the lower one.
Editing Color
You can select your own combinations of red, green, and blue for a colortable to see different effects in the image display. In this example you will change the color of data with values 40 and 60.
2. Enter 40 in the Selected Color text field, and press <Return> to select colortable index 40.
3. Place the pointer on the slider portion of the scale labeled Blue. Press and hold down MB1 and drag the slider to the right to set this color index to a shade of blue. Release MB1 after adjusting the scale.
You can see the changes in the color display of the image as you interact with the slider.
4. Now do the same for the color index 60, but make it green. Take a moment to look at the remarkable highlighting effects in the flame image. Try experimenting with other color changes.
5. Close the WzColorEdit Tool.
6. Finally, compare this enhanced, modified image with the original image displayed in window WzImage_0.
Experimenting on Your Own
In this session, you have learned how to do the following:
Read 8-bit image data from a file.
Use PV‑WAVE commands to improve the quality and contrast of an image.
Interactively subset an image before performing further analysis on a region of interest.
Change the appearance of an image by selecting a different colortable.
If you have any 8-bit (or byte) data of your own that would lend itself to visual display, try it.
Saving the Session
When you save a Navigator session, you can save all or some of the VDA Tools that are currently open. Once the session is saved, you can reopen it at any time, fully restoring the VDA Tools and data that was saved.
1. Select File=>Save Session from the Navigator menu bar. The Save Session dialog box appears.
2. In the Save Session dialog box, select the following items from the list using MB1 to select the first item and <Shift>-MB1 to select the others: WzImage_0, WzImage_1, WzVariable_0.
3. In the Session File Name text field, type: flame.sav
4. Click the OK button.
Now the session is saved. To restore the session at any time in the future, simply start PV‑WAVE and the Navigator, then use the File=>Restore Session function from the Navigator menu bar.
Ending the Session
You can now either exit the PV‑WAVE session or start a new tutorial without quitting.
To exit the Navigator, select
File=>Close on the Navigator
window.
To exit PV‑WAVE type
EXIT at the
WAVE> prompt.
Version 2017.1
Copyright © 2019, Rogue Wave Software, Inc. All Rights Reserved.