BAR Procedure
Plots a 2D bar graph that can include stacked and grouped bars, as well as various color and fill pattern options.
Usage
BAR[, x], y
Input Parameters
x—(optional) An array of values to plot along the x-axis. The values y(i) are plotted from x(i) to x(i+1).
y—An array of values to plot along the y-axis (or the x-axis if /Horizontal is specified).

If
y is a 1D or 2D array and the
Stack keyword is not set, then the first dimension is construed as a group and the second dimension as a bar value.
If
y is a 1D or 2D array and the
Stack keyword is set, then the first dimension is construed as a stack and the second dimension as a bar value.
If
y is a 3D array, then the first dimension is construed as a group, the second as the stack, and the third as a bar in a stack in a group. The
Stack keyword is not relevant.
note | Each of these plotting options is discussed in the Examples section. |
Keywords
Barmin—Sets the value to draw the bars down to. (Default: 0)
DrawLegendBox—If nonzero, a box is drawn around the legend. (Default: no box)
Endpoints—If set, y is a 2D array containing endpoints (minimum and maximum values) and Grouped and Stacked keywords are not available.
FillColors—Specifies a 1D array of color index values. These values specify the colors with which the bars are filled. By default, the bars are filled with solid color. If either FillSpacing or FillOrientation are used, the bars are filled with lines instead of solid color. In this case, FillColors specifies the line colors. (Default: no fill color)
FillLinestyle—An integer or integer array specifying the style of fill lines. If set to a scalar, all bars are filled with the same linestyle. If set to an array, the linestyle of each bar is mapped, sequentially, to the value of each array index. (Default: !P.Linestyle)
note | This keyword has no effect unless either FillSpacing or FillOrientation are used. |
Valid linestyle indices are shown in
Linestyle Indices.
FillOrientation—A floating point scalar or array specifying the orientation of fill lines, in degrees, counterclockwise from the horizontal. If set to a scalar, the orientation of fill lines in all bars is the same. If set to an array, the orientation of each bar is mapped, sequentially, to the value of each array index. (Default: Horizontal lines)
FillSpacing—A floating point scalar or array specifying the space, in centimeters, between fill lines. If set to a scalar, the spacing between lines in all bars is the same. If set to an array, the spacing for each bar is mapped, sequentially, to the value of each array index. (Default: five times the value of the FillThick keyword, converted to centimeters.)
FillThick—A floating point scalar or array specifying the thickness of fill lines. If set to a scalar, all bars are filled with lines of the same thickness. If set to an array, the thicknesses are mapped, sequentially, to the value of each array index. A thickness of 1 is normal, two is double-wide, and so on. (Default: !P.Thick)
note | This keyword has no effect unless either FillSpacing or FillOrientation are used. |
Horizontal—If nonzero, the y values are shown on the x-axis. If zero, the x values are shown on the y-axis.
LegendBoxColor—An integer specifying the color of the legend box.
LegendCharSize—A floating-point scalar specifying the size of text in the legend. (Default: 1.0).
LegendLabels—An array of strings used to label individual bars. The number of strings in the array must correspond to the number of individual bars.
LegendPosition—A four-element floating point array specifying the position of the legend in normal coordinates.
LegendTextColor—An integer specifying the color of the text in the legend.
LineColors—Specifies a 1D array of color indices.
OutlineColor—An integer specifying the color index to use for the color of the outline for the bars (Default: !P.Color)
Stacked—If the input array is a 2D array and the Stacked keyword is set, then the first dimension of the input array is construed as a stack and the second dimension as a bar value. See the Examples section for examples of stacked and grouped bar charts.
Width—Sets the width of each bar. When set to 1, bars touch each other. When set to 0.5, bars are separated by the width of a bar. (Default: 0.8)
XTickName—An array of strings specifying the names of tick marks. If the bar chart represents simple bars or stacked bars, the tick name corresponds to each one. If the bar chart represents groups of bars or stacked bars, the XTickName correspond to each group.
YTickName—An array of strings, for the y-axis (or x-axis if the Horizontal keyword is specified), which specifies both the number of major tick marks (with no minor tick mark) and their labeling.
Additional BAR keywords are listed below. For a description of each keyword, see
Graphics and Plotting Keywords.
Discussion
The x and y variables must be simple numeric types. The dependent axis only shows major tick marks. Tick marks are placed in the center, to the left, and to the right of individual bars or groups of bars. Only the center tick is labeled.
Either the FillLineStyle or FillOrientation keyword (or both) must be specified to fill the bars with lines.
A stacked bar is a bar that depicts more than one value, where each value is shown on top of the previous value. A group is a set of two or more related bars appearing next to one another on the chart. It is possible to create grouped bars that are also stacked. Refer to the following examples for information on producing stacked and grouped bar charts.
The BAR2D procedure also draws bar graphs; however, it does not permit stacked and grouped bars.
Examples
This section includes three example plots. First, data is defined for the examples. Then the following bar plots are created:
A horizontal bar chart with a legend. The bars are filled with colors and patterns.
A chart of grouped bars with a legend. The bars are filled with colors and patterns.
A chart of stacked and grouped bars. This plot includes a legend and pattern-filled bars.
Define Data for the Examples
; The following expressions create an array of data to plot (the
; bar values) and tick names for the x and y-axes.
simple = [ 10, 20, 10, 40]
XTickNames=['Quarter 1', 'Quarter 2', 'Quarter 3', 'Quarter 4']
YTickNames=['$ 0000', '$ 1000', '$ 2000', '$ 3000']
TEK_COLOR
; The following expression creates a 2D array specifying data for
; four groups of bars containing three sets of bars per group.
group1 = [ [ 100, 200, 100], [200, 150, 100], [400, 200, 100], $
[100, 110, 120]]
; The following expression creates a 3D array specifying data for
; two groups of bars containing three stacks with two values per
; stack.
group2 = [ [ [10, 20], [30, 40], [100, 60]], $
[ [30, 10], [50, 50], [60, 40]]]
Example 1: Horizontal Bars
Note that the patterns inside the bars are created by filling the bars with lines of various styles and thicknesses. The results are shown in
Horizontal Bar Char with Legend.
BAR, simple, XTickName=XTickNames, YTickName=YTickNames, $
FillOrientation=[30, 10, 0, 90], LineCol=WoColorConvert([1,3,5,7]), $
Outline=4, Fillcolors=WoColorConvert([4, 5, 7, 1]), $
Filllinestyle=[1,2,3,4], Fillthick=[1,2,3,4], $
LegendLabel=['EAST', 'NORTH', 'WEST', 'SOUTH'], $
LegendTextColor=WoColorConvert(5), LegendCharSize=2, $
LegendPosition=[0.00, 0.3, 0.22, 0.6], $
Position=[0.3, 0.1, 0.95, 0.95], $
/Horizontal, Title='Patterned Horizontal Bar'
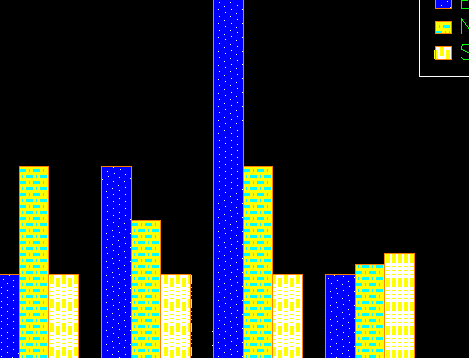
Example 2: Grouped Bars
In this example, a 2D array is used to create a chart of grouped bars. The results are shown in
Bar Chart with Grouped Bars and Legend.
BAR, group1, XTickName=XTickNames, YTickName=YTickNames, $
FillOrientation=[30, 0, 90], LineCol=WoColorConvert([1,5,7]), $
Outline=8, Fillcolors=WoColorConvert([4, 7, 1]), $
FillLinestyle=WoColorConvert([1,3,4]), Fillthick=[1,3,4], $
LegendLabel=['EAST', 'NORTH', 'SOUTH'], $
LegendTextColor=WoColorConvert(3), $
LegendCharSize=2, /DrawLegendBox, $
LegendPosition=[0.79, 0.7, 0.99, 0.9], $
Position=[0.1, 0.1, 0.8, 0.95], Title='Grouped Bars'
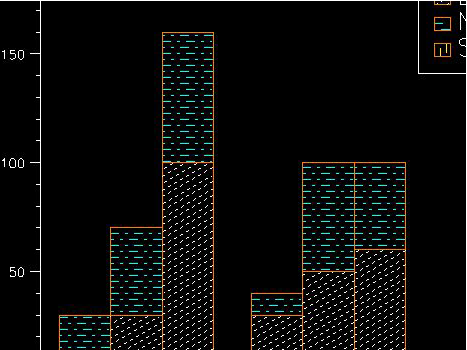
Example 3: Stacked Bars
In this example, a 3D array is used to create a chart of grouped and stacked bars. The results are shown in
Bar Chart with Grouped and Stacked Bars.
BAR, group2, XTickName=XTickNames, $
FillOrientation=[30, 0, 90], LineCol=WoColorConvert([1,5,7]), $
Filllinestyle=WoColorConvert([1,3,4]), Outline=WoColorConvert(8), $
LegendLabel=['EAST', 'NORTH', 'SOUTH'], $
LegendTextColor=WoColorConvert(1), $
LegendCharSize=2.0, /DrawLegendBox,$
LegendPosition=[0.79, 0.7, 0.99, 0.9], $
Position=[0.2, 0.1, 0.8, 0.95], $
/Stacked, Title='Stacked Bars'
Version 2017.1
Copyright © 2019, Rogue Wave Software, Inc. All Rights Reserved.