 |
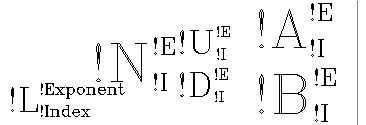
b = '!LLower !NNormal!S!UUp!R!DDown' + '!N!S!AAbove!R!BBelow'
XYOUTS,.02,.2,b,size=3,/Normal
|
A = '!6!L!!L!S!E!!Exponent!R!I!!Index' + $
'!N!!N!S!I!!I!R!E!!E!N'+'!S!U!!U!S!I!!I!R!E!!E!R!D!!D!S' + $
'!E!!E!R!I!!I!N !S!A!!A!S!E!!E!R!I' + $
'!!I!R!B!!B!S!E!!E!R!I!!I'
XYOUTS, .02, .5, A, Size = 5, /Normal
 |
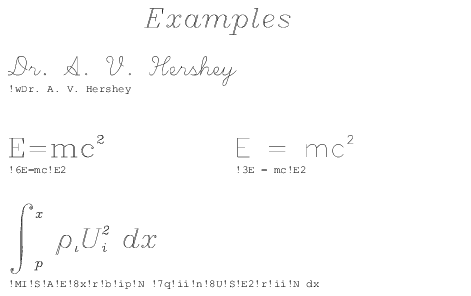 |
XYOUTS, 0, .2,'!MI!S!A!E!8x!R!B!Ip!N!7q' + $
'!Ii!N!8U!S!E2!R!Ii!N dx', SIZE=3, /NORMAL
Format Command | Description |
!MI | Changes to math set and draws the integral sign, uppercase I. |
!S | Saves the current position on the position stack. |
!A!E!8x | Shifts above the division line and to the exponent level, switches to font 8 the Complex Italic font, and draws the “x”. |
!R!B!Ip | Restores the position to the position immediately after the integral sign, shifts below the division line to the index level and draws the “p”. |
!N! 7q | Returns to the normal level, advances one space, shifts to the Complex Greek font (number 7), and draws the greek letter “rho” which is designated by “q” in this set. |
!Ii!N | Shifts to the index level and draws the “i” at the index level. Returns to the normal level. |
!8U | Shifts to the Complex Italic set (number 8), and outputs the uppercase “U”. |
!S!E2 | Saves the position and draws the exponent “2”. |
!R!Ii | Restores the position and draws the index “i”. |
!N dx | Returns to the normal level and outputs “dx”. |
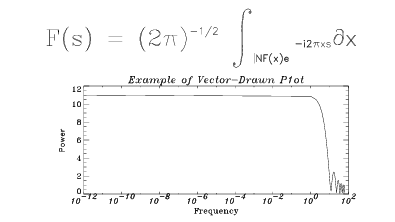
; Define an array.
X = FLTARR(128)
; Make a step function.
X(30:40) = 1.
; Take FFT and magnitude.
X = ABS(FFT(X,1))
; Produce a Log-Linear plot. Use the Triplex Roman font for the
; x title (!17), Duplex Roman for the y title (!5), and Triplex
; Italic for the main title (!18). The Position keyword is used to; shrink the plotting “window”.
PLOT_OI, X(0:64), Xtitle = '!17Frequency', Ytitle = '!5Power', $
Title = '!18Example of Vector-Drawn P1ot', $
Position = [.2, .2, .9, .6]
; String to produce equation.
ss = '!6F(s) = (2!4p)!e-1/2!N !MI!S!A!E!' + $
'M!R!B!I!M!!NF(x)e !e-i2!4p!3xs!n!MDx'
; Output string over plot. The Noclip keyword is needed because; the previous plot caused the clipping region to shrink.
XYOUTS, 0.1, 0.75, ss, Size = 3, /Normal, /Noclip
 |