Using Color to Enhance Visual Data Analysis
Color is a valuable aid in the visual analysis process, because it can be used to take advantage of the human brain’s capability to distinguish fine gradations of shade and intensity. Color can also be used to simply draw one’s attention to a certain part of the screen, or to a certain region of a plot or image.
This section discusses:

loading predefined and custom color tables
modifying color tables to create special effects
plotting colors used for the elements of “simple” plots
note | To use color, you must use a workstation that is capable of utilizing a display with color. However, no information is lost if you open a saved session on a monochrome or gray-scale workstation that was originally saved on a color workstation. |
Experimenting with Different Color Tables
Most color workstations cannot display more than a certain number of colors (usually 256) at once. For this reason, color tables are used to map red, green, and blue values into the available colors on the workstation.
PV‑WAVE includes an assortment of 16 predefined color tables with enough variety to produce visually pleasing results for many applications, or you can define your own color table.
You can use either the TVLCT or the LOADCT procedures to load the color table on the current device:
LOADCT—This procedure loads predefined color tables stored in the file
colors.tbl. This file is in:
(UNIX) <wavedir>/bin
(WIN) <wavedir>\bin
Where <wavedir> is the main PV‑WAVE directory.
TVLCT—This procedure loads color tables stored in user-defined variables. Once the variables are loaded into the color table, it is used like any other color table.
The color table functions let you modify the colors used to display images, shaded surfaces, and vector graphics inside graphics windows. Vector graphics colors (also called
plot colors) let you control the colors assigned to elements of line plots, scatter plots, contour plots, and unshaded surfaces. For more information on how to manipulate plot colors, see
"Controlling Plot Colors".
For color and gray-scale devices, the default is to display 8-bit graphics using the color table B–W Linear (standard color table number 0).
Number of Colors in the Color Table Under UNIX
Under UNIX, the color table will allocate as many colors as it can, but the number of colors it can actually use is affected by the type of system you have and its configuration:
Graphics output to “simple” graphics devices (for example, Tektronix terminals or emulators)—The color table defines all 256 colors, even though the device can probably only uniquely display a much smaller number of colors, such as 16, 32, or 64. The device will automatically begin to reuse colors whenever it reaches its limit.
Graphics output in a multi-tasking windowing environment (for example, the X Window System)—By default, the color table defines (and allocates) every color that has not been previously allocated by the window manager or some other application.
For more information about how to reserve colors for the window manager in an X environment, refer to the PV‑WAVE Reference.
Loading a Predefined Color Table: LOADCT
Use LOADCT to load one of the predefined color tables. There are 16 color tables, ranging from 0 to 15, in the file colors.tbl. This file is in:
(UNIX) <wavedir>/bin
(WIN) <wavedir>\bin
Where <wavedir> is the main PV-WAVE directory.
LOADCT has one parameter—the index of the predefined color table to be loaded. For example, the following command loads the Red Temperature color table:
LOADCT, 3
note | To obtain a menu listing of the available color tables, call LOADCT with no parameters. |
Loading Your Own Color Tables: TVLCT
Use the TVLCT procedure to load a color table using data stored in variables. When calling TVLCT, you supply three vectors containing the intensity or value of each color (red, green, and blue) for each index. Given an n-bit color representation, each element must be in the range of 0 to 2n – 1. These vectors may contain up to 2m elements, assuming the display contains m-bit pixels. You can also supply an index pointing into the color translation table, but this is optional. If not specified, a value of 0 is used, causing the tables to be loaded starting at the first element of the translation table vectors.
The TVLCT procedure can also use optional keyword parameters. For information on the keywords, see the TVLCT description in the PV‑WAVE Reference.
Example—Modifying Color Tables from Command Line
The INDGEN function is well-suited for creating larger color tables in which each color’s intensity can be expressed as a function of its index. In this example, INDGEN is used to create a linear 256-element color table that is then used to display images in a variety of ways:
; Create a “straight line” variable, A(I)=I.
A = INDGEN(256)
; Display image with a linear red scale; disable green and blue.
TVLCT, A, A*0, A*0
; Display image with linear black and white scale.
TVLCT, A, A, A
; Display image with a warm-body temperature scale. Red is linear
; (starting at 0), green starts at 128, and blue starts at 192.
TVLCT, A, 2 * (A-128) > 64, 4 * (A-192) > 0
Modifying the Color Tables
PV‑WAVE provides many commands and widget-based utilities that you can use to modify existing color tables and to create new ones. Many of the possibilities are described in the following sections.
The color table modifications discussed in this section only affect the contents of PV‑WAVE graphics windows. If you need to control the colors used in the background, foreground, and border of your window-managed GUI (graphical user interface), you must use different techniques than those described in this section. For more information about selecting GUI colors, refer to the PV‑WAVE Application Developer’s Guide.
Modifying the Predefined Color Tables
The MODIFYCT procedure is used to update the file colors.tbl with a new color table (i.e., a new named color table that will take the place of one of the color tables in colors.tbl). This file is in:
(UNIX) <wavedir>/bin
(WIN) <wavedir>\bin
Where <wavedir> is the main PV-WAVE directory.
This procedure should only be used by persons authorized to change the predefined color tables supplied with PV‑WAVE. In other words, you may need to contact your System Administrator for assistance.
note | Except for editing colors.tbl directly, the MODIFYCT command is the only way to modify the predefined standard color tables. For detailed information about using the MODIFYCT command, refer to the MODIFYCT description in the PV‑WAVE Reference. |
Modifying Color Tables Using Widget-based Utility Tools
PV‑WAVE provides several widget-based tools that you can use to interactively modify the color tables.
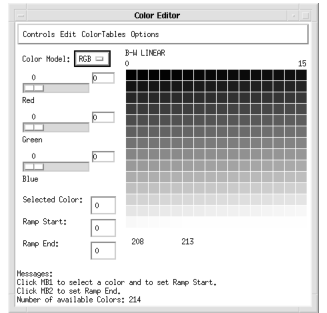
WgCeditTool—A full-featured set of menus and widgets enclosed in a window; this window allows you to edit the values in PV‑WAVE color tables in many different ways. WgCeditTool also provides a way to save your color table changes using a name that you choose. The WgCeditTool window is shown in
Figure 11-2: WgCeditTool on page 292.
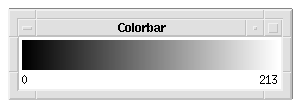
WgCbarTool—A simple vertical or horizontal color bar that can be used to interactively shift a PV‑WAVE color table. WgCbarTool can easily be included inside larger container widgets. The WgCbarTool window is shown in
Figure 11-3: WgCbarTool on page 294.
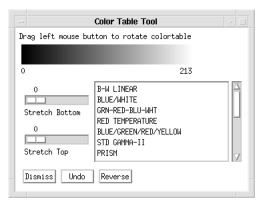
WgCtTool—A simple widget that can be used interactively to modify a color table. WgCtTool provides widgets that you can use to stretch, rotate, and reverse the current color table. The WgCtTool window is shown in
Figure 11-4: WgCtTool on page 296.
WgCeditTool, WgCbarTool, and WgCtTool can only be used if you are also running a window manager. If you are an experienced programmer, consider providing access to these widget-based utility tools via your PV‑WAVE application, so that people using your application can interactively modify and create new color tables without entering commands at the WAVE> prompt.
Shifting Color Table to Left or Right
The following sections describe how to shift the color table using the PV‑WAVE prompt or the utility widget WgCbarTool.
Shifting Colors from the PV‑WAVE Prompt
This section discusses how the color table’s red, green, and blue components can be altered with the SHIFT function to produce a modified color table. Shifting the color table in this manner produces the same basic effect as shifting it with WgCbarTool, except you can precisely control the amount of shifting that occurs and use different amounts of shifting for the red, green, and blue components. For information about WgCbarTool, see the next section.
You can “shift” the color table to the left or right to change the color indices that are associated with each color value. All the color table values are still present in the color table, but the color table uses different colors for the start and the end.
note | Following the same basic procedure, you can experiment with other functions and procedures to produce different effects in the color table, such as producing a nonlinearly interpolated color ramp. |
To shift the color table, access the three color variables, as described in
"Retrieving Information About Current Color Table". Then process each of the three variables (red, green, and blue) by shifting them some amount, such as:
shr = SHIFT(r_curr, 28)
shg = SHIFT(g_curr, 56)
shb = SHIFT(b_curr, 84)
The amount of shifting can be any integer amount up to 236 (Windows) or 256 (UNIX) (if you are using all available colors). Remember that a shift of zero (0) is equivalent to no shifting of the variable.
After the variables are processed, use them to load the current color table using the TVLCT command.
Shifting Colors Using the Utility Widget WgCbarTool
WgCbarTool creates a simple color bar that can be used to view and interactively shift a color table. The horizontal form of the color bar is shown in
WgCbarTool.
To rotate the color table using the color bar, press and drag the left mouse button inside the color bar. As you “slide” colors into different color table indices, the colors that “scroll off” the end of the color table are added to the opposite end.
Smoothing the Color Transitions in a Color Table
This section describes a technique for smoothing out any place in a color table where there is a sharp transition from one color to the next color. This technique involves the SMOOTH function.
This technique helps a color table seem less harsh and helps reduce the banding or “contouring” artifact evident in color tables that have rapid transitions between colors. Otherwise, you may see an artificially pronounced transition in data that actually has no rapid transitions.
To smooth the color table, access the three color variables, as described in
"Retrieving Information About Current Color Table". Then process each of the three variables (red, green, and blue) by smoothing them by some amount, such as:
smr = SMOOTH(r_curr, 5)
smg = SMOOTH(g_curr, 5)
smb = SMOOTH(b_curr, 5)
Initially, start out with a width of 5 (this is the width of the “boxcar” smoothing window), and adjust that width up or down as needed to get the most pleasing results. Additionally, you may want to broaden the boxcar smoothing width if you are using all 256 (UNIX) or 236 (Windows) colors.
After the variables are processed, use them to load the current color table using the TVLCT command.
Stretching the Color Table
This section describes how to linearly expand a range within a color table to provide more detail for that range of pixel values.
Stretching Colors from the PV‑WAVE Prompt
For example, the color table’s red, green, and blue components could be stretched to emphasize a certain range of values in the image. To stretch all three components, enter this command:
STRETCH, 15, 90
STRETCH linearly interpolates new red, green, and blue color vectors between the low number and the high number. In other words, the low number (15) is the pixel value that is displayed with color index 0, and the high number (90) is the pixel value that is displayed with the highest color index available. Pixel values between 15 and 90 are displayed proportionately, and pixels outside the range are displayed with either the “low color” or the “high color”.
note | The STRETCH procedure does not affect the data or the current color table stored in the Colors common block; it only affects the way the data is displayed. For information about the Colors common block, see
"Retrieving Information About Current Color Table". |
Stretching Colors Using the Utility Widget WgCtTool
WgCtTool allows you to interactively modify system color tables by stretching, rotating, and reversing them. A range of color table indices, as defined by the Stretch Bottom and Stretch Top sliders, can be linearly stretched.
The Stretch Bottom number is used for the first parameter to the STRETCH command, and the Stretch Top number is subtracted from the number of colors available in the color table to determine the second parameter to the STRETCH command. For more information about the STRETCH command, refer to the previous section or to the description for STRETCH in the PV‑WAVE Reference.
note | Because system color tables are “read-only”, no system color table will be permanently altered by any changes you make with the WgCtTool window. |
Retrieving Information About Current Color Table
Most color table procedures maintain the current color table in a common block called Colors, defined as follows:
COMMON Colors, r_orig, g_orig, b_orig, r_curr, g_curr, b_curr
The variables are integer vectors of length equal to the number of color indices. Your program can access these variables by declaring the common block. The convention is that routines that modify the current color table should read it from r_orig, g_orig, and b_orig, and then load and leave the resulting color table in r_curr, g_curr, and b_curr.
Controlling Plot Colors
The currently loaded color table determines plot colors (see the following discussion entitled
"Default Plot Colors").
Plot colors are those colors used to display data, axes, axis titles, and other elements of line plots, scatter plots, contour plots, and unshaded surfaces. But it is possible that the current color table (or any other standard color table) does not provide the colors you wish to use for plotting your data.
For example, in many of the color tables, there are only subtle differences between adjacent colors in the middle range of the color table. This makes many of the standard color tables better suited for the display of images than they are for the display of data inside a line plot or bar chart.
To customize your plot colors, load new red, green, and blue color vectors defining the colors you want. To load new color vectors, use the technique demonstrated in the example in this section, or use the TVLCT procedure. The TVLCT procedure is discussed in
"Loading Your Own Color Tables: TVLCT".
Another quick way to obtain a nice set of plot colors is using the TEK_COLOR procedure. The TEK_COLOR procedure is handy because it loads a color table that mimics the 32 distinct plot colors of the Tektronix 4115 display device. The TEK_COLOR procedure is discussed in
"Using the TEK_COLOR Command to Control Plot Colors".
For more information about the standard color tables, refer to
"Loading a Predefined Color Table: LOADCT".
Default Plot Colors
By default, when drawing vector graphics on the screen using the default color table, Black and White Linear, PV‑WAVE draws a white line on a black background. However, you can use the Color keyword (with the PLOT command) to choose any other available color. For example:
PLOT, x_data, y_data, Color=144, ... ...
Unless you supply the
Color keyword, color index 0 (often a dark color) is used for the background, and the highest color index (often a light color) is used for the lines. This means that by default, a light color is used for plotting data, axes, titles, and so forth. The highest color index is stored in a system variable, !D.N_Colors. For more information about !D.N_Colors, see the section entitled
"Determining the Number of Available Plot Colors".
note | Some hardcopy devices that print on white paper automatically swap the foreground and background colors so that on paper, the lines are drawn with a dark color instead of a light color. Otherwise, the hardcopy would be drawn with white on white, and the paper would appear blank. (Please be aware that some color output devices do not adhere to this convention, although most monochrome output devices do.) |
Determining the Number of Available Plot Colors
Use the system variable !D.N_Colors to find out the number of simultaneously available colors for a particular device. In the case of devices with windows, this field of the device (!D) system variable is set after the window is initialized.
note | For monochrome systems, !D.N_Colors is 2, and for color systems it is normally 256. Under Windows, !D.N_Colors is always 256. |
If you are using PV‑WAVE in a multi-tasking environment under the control of a window manager, some color indices may be reserved for the window manager and for other applications that are running simultaneously with PV‑WAVE, and this in turn will affect the value of D.N_Colors.
note | For more information about why colors are reserved for the window manager in an X environment, refer to the PV‑WAVE Reference. |
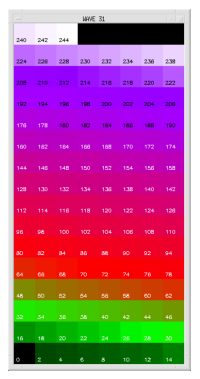
PV‑WAVE provides sixteen standard color tables and users can easily modify these color tables or define their own. In
Standard Color Table, the COLOR_PALETTE procedure is displaying every other color in the current color table, along with its color table index. The black cells in the upper-right corner of the window represent colors that are not available to PV‑WAVE because they have been reserved by some other application, such as the window manager. The Motif version of the color palette is shown here.
note | The COLOR_PALETTE procedure displays an array of color cells and the color table index associated with each one, as shown in
Figure 11-2: WgCeditTool on page 292. The largest number you see displayed in the array of color cells reflects the current value of !D.N_Colors. For more information on this procedure, see the PV‑WAVE Reference. |
Example—Creating a Simple Color Table to Control Plot Colors
This example creates a graph with the axes drawn in white (on a black background), then successively adds red, green, blue, and yellow lines. Because five distinct colors are needed, plus one color for the background, a six-element color table is created. In this color table, color index 0 represents black (0, 0, 0), color index 1 is white (1, 1, 1), 2 is red (1, 0, 0), 3 is green (0, 1, 0), 4 is blue (0, 0, 1), and 5 is yellow (1, 1, 0).
; Specify red component of each color (1 = full intensity,
; 0 = no intensity)...
red = [0,1,1,0,0,1]
; ... green component.
green = [0,1,0,1,0,1]
; ... blue component.
blue = [0,1,0,0,1,0]
; With a single command, multiply each element in the red, green,
; and blue vectors, and load first six elements of color table.
; The remaining colors in the color table are not affected.
TVLCT, 255*red, 255*green, 255*blue
; Draw the axes in white, color index 1.
PLOT, Color = 1, /Nodata, ... ...
; Draw in red.
OPLOT, Color = 2, ... ...
; Draw in green.
OPLOT, Color = 3, ... ...
; Draw in blue.
OPLOT, Color = 4, ... ...
; Draw in yellow.
OPLOT, Color = 5, ... ...
note | For this example to work on your display, your display must have at least three bits per pixel so it can simultaneously represent six colors. An 8-bit color table is assumed. |
Using the TEK_COLOR Command to Control Plot Colors
Another easy way to change the colors in the lower end of the color table is to enter the TEK_COLOR command; this command loads 32 predefined, unique, highly saturated colors into the bottom 32 indices of the color table. When the TEK_COLOR color table is in effect, you will be able to easily differentiate the different data sets in a line plot.
Example
The TEK_COLOR procedure has no keywords or parameters, so it is simple to use. This example shows how the TEK_COLOR colors can be used to produce bright, vibrant fill colors.
b = FINDGEN(37)
x = b * 10
; Create an array containing the values for a sine function from
; 0 to 360 degrees.
y = SIN(x * !Dtor)
; Plot data and set the range to be exactly 0 to 360.
PLOT, x, y, XRange = [0,360], XStyle=1, YStyle=1
; Display current color table and its associated color indices.
COLOR_PALETTE
; Load a predefined color table that contains 32 distinct colors.
TEK_COLOR
; Fill in areas under the curve with different colors.
POLYFILL, x, y, Color = 6
POLYFILL, x, y/2, Color = 3
POLYFILL, x, y/6, Color = 4
; Create array containing values for COS function from 0 to 360
; degrees.
z = COS(x * !Dtor)
; Plot the cosine data on top of the sine data.
OPLOT, x, z/8, Linestyle = 2, Color = 5
note | The color table indices specified with the Color keyword must be in the range {0 ... 31} to take advantage of the bright colors created by the TEK_COLOR procedure. Color table indices above 31 are not affected by the TEK_COLOR procedure, and will remain as defined by the previously loaded color table. |
Specifying Plot Colors on a 24-bit Display (UNIX)
For your convenience, PV‑WAVE allows 24-bit colors to be specified in hexadecimal notation. You may want to enter hexadecimal colors if you are controlling plot colors on a 24-bit display. Because this is most frequently done while operating under the control of a window manager in an X Window System environment, refer to the PV‑WAVE Reference for more details.
Version 2017.1
Copyright © 2019, Rogue Wave Software, Inc. All Rights Reserved.