Overview of Eclipse
Eclipse is a Java-based integrated development environment that was developed and open sourced by IBM. It is the basis for IBM's commercial WebSphere Application Development environment, and for a number of other tools. Eclipse has an active community of developers who develop Eclipse itself and the large number of plug-ins available for it. More information about Eclipse is available at
www.eclipse.org.
The Eclipse framework provides a common set of editing and debugging capabilities, and it includes a plug-in architecture that makes it easy to extend to other programming languages and utilities. In addition to the PV-WAVE editor/debugger, there are editors/debuggers for Java, C, Perl, Python, and a number of other programming languages. There are also Eclipse plug-ins for source code control (CVS, Subversion), bug tracking, and database development. The Eclipse project provides a web portal for obtaining and downloading plug-ins:
www.eclipseplugincentral.com/.
Key Eclipse Concepts
 Workbench
—The Workbench is the user interface for interacting with the Eclipse framework. When you run Eclipse, you are interacting with the Workbench.
Project—A Project is a logical repository for PV-WAVE source code and configuration information. Project files can be imported or exported, and projects can be opened or closed.
Perspective—A Perspective is a way of viewing files and runtime information. Think of it as a “window” into Eclipse Views and Editors. In this tutorial, we will be using the PV-WAVE and Debug Perspectives.
Editor—An Editor is a tool for editing files (usually source code). Eclipse supports editors for a number of programming languages and file formats. In this tutorial, we will be using the PV-WAVE editor.
View—A View is a graphical tool that provides an alternative presentation of information in the Workbench, and sometimes also provides navigation capabilities. In this tutorial, we will work with the Navigator, Outline, and Console views.
Installing
Download and install the Eclipse SDK from the web site
www.eclipse.org, following the installation instructions appropriate for your platform.
note | PV-WAVE uses Java 1.8.0_121-b13 and Eclipse Neon 2 SDK 4.6. |
The PV-WAVE Eclipse debugger is supported for version 9.0 and above of PV-WAVE. Installation of the Eclipse plug-in for PV-WAVE requires the following step:
In the directory <RW_DIR>/wave/bin/plugins are these two files:
com.vni.wave.debug_3.0.0.jar
com.vni.wave_3.0.0.jar
Note: RW_DIR is the root directory where you have installed PV-WAVE. These files must be copied to your Eclipse installation in the directory:
<ECLIPSE_HOME>/plugins
Where <ECLIPSE_HOME> is the path where you have installed Eclipse. After copying the files the next time you start Eclipse the PV-WAVE plug-in is available.
PV-WAVE Preferences Window
PV-WAVE preferences can be reached via
Window > Preferences (
Eclipse > Preferences on OSX) and selecting PV-WAVE (see
PV-WAVE preferences window – executable location). The first preference is very important and you are required to set this field the first time you run the plug-in. It lets you select or change the location of the PV-WAVE executable to use. It is possible to have multiple versions of PV-WAVE installed and to use this configuration to select which to use for a particular session.
For Windows platforms, this is the location of the wave.exe executable file, usually at <RW_DIR>/wave/bin/<OS>/wave.exe, where <OS> is the directory that matches your PV-WAVE installation, bin.i386nt for 32-bit and bin.win64 for 64-bit. For Unix platforms, it is the location of the PV-WAVE script, usually located at $RW_DIR/wave/bin/wave.
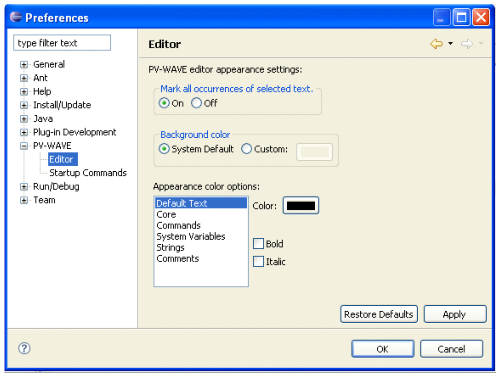
Additional preferences are available when you expand
PV-WAVE and select
Editor (
PV-WAVE preferences window – editor preferences). You can change background and syntax coloring and turn off Auto Search.
Importing the sample project
To access the sample code used within this tutorial, do the following:
1. Unzip the file <RW_DIR>/wave/bin/plugins/tutorial.zip into your file system.
2. Import the contained project into Eclipse. To import the project, do the following:
a. Switch into the PV-WAVE perspective. You can select the available perspective from the upper right corner of Eclipse IDE.
b. Select File > Import > General and select “Existing Project into Workspace”
c. Select the root directory where you expanded the zip file and press Finish. You are presented with a PV-WAVE perspective and the “PV-Wave Tutorial” project now appears in the Navigator view.
A Tour of the PV-WAVE Plug-In
You'll now learn how to use the imported project to edit and debug PV-WAVE source code, including the following:
Editing PV-WAVE source code
PV-WAVE syntax highlighting
PV-WAVE syntax analysis, highlighting errors in the PV-WAVE editor and in the Problems View
Converting Tabs into spaces
Working with the Outline view
Functions and procedures in a source file
Running a PV-WAVE program from Eclipse
Debugging PV-WAVE Code
Breakpoints
Stepping through code
Displaying and modifying variable values
Interaction with PV-WAVE command line.
Working with source code
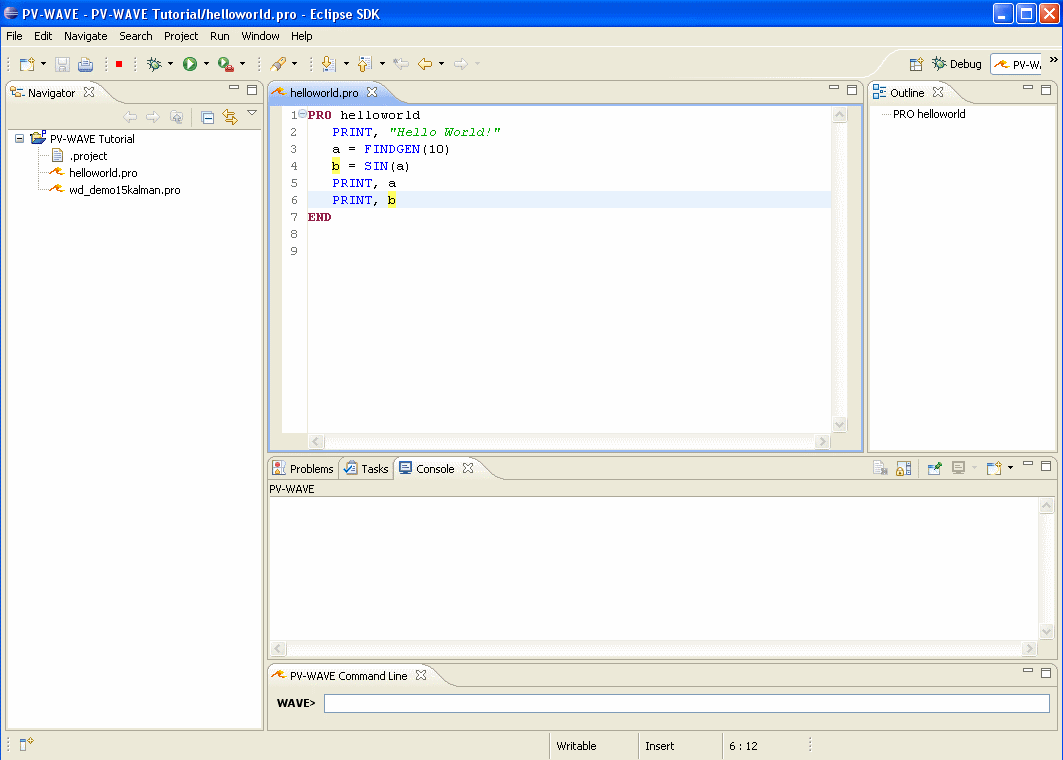
Source code development is performed within the PV-WAVE perspective. Switch into this perspective by clicking on the PV-WAVE icon in the upper right corner of the screen. Now, in the Navigator view at the top left, double click on the file:
PV-WAVE Tutorial\helloworld.pro
The PV-WAVE editor opens the file, parsing the PV-WAVE syntax for syntax coloring and syntax checking (see
PV-WAVE editor view showing syntax highlighting).
If any errors are found in the source, the offending lines are marked in the code and errors displayed in the Problems view at the bottom.
The Outline view on the right displays the structure of the file currently being edited. Procedures and functions are displayed, and may be navigated to by clicking on the item in the Outline view. The Outline view is updated and syntax checking performed every time a file is saved.
Editor features
Important editor features include:
Syntax highlighting—Code is color coded to distinguish comments, PV-WAVE commands and operators, PV-WAVE functions and procedures, and string constants.
Outline View—This view shows all procedures and functions in the current file being edited. You can navigate directly to a procedure/function simply by clicking on the name. This view is updated when you save a file.
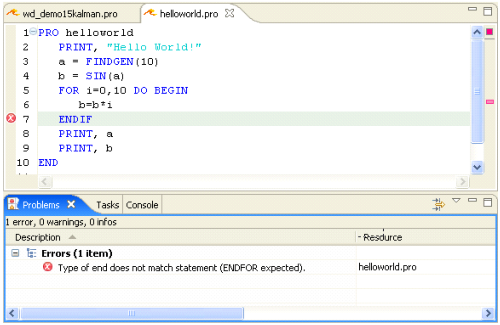
Interactive Syntax checking—Each procedure is compiled after every save operation and any reported compile errors are reported and marked in the code.
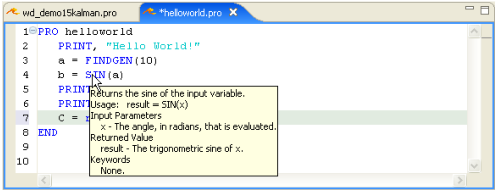
Hover help—When you hover over a supported PV-WAVE procedure or function, a pop-up dialog displays the basic syntax for calling the procedure/function, including positional parameters and keyword parameters.
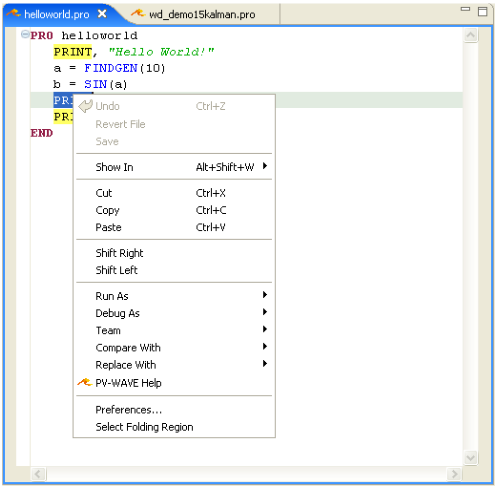
Online Help—To get more detailed help on a procedure/function, double click on the procedure/function in the code editor and then right click and select
PV-WAVE Help. This brings up the full online help for that procedure/function in a separate browser window. In this browser you can navigate to an index of all commands if desired as this is the full browser based online help system.
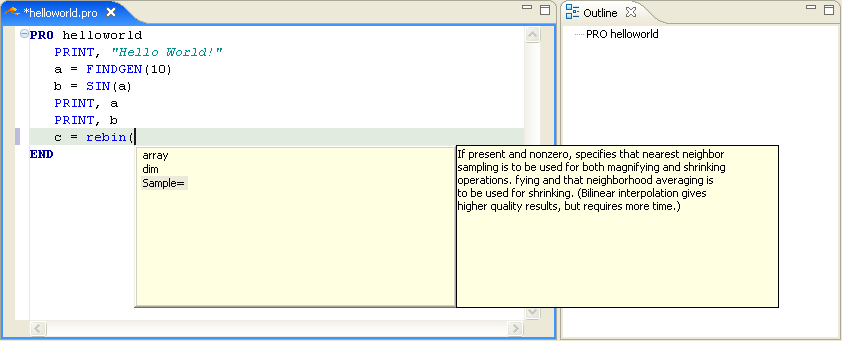
Command Completion—When you start to type a PV-WAVE procedure or function name and press the first parenthesis or comma, a popup window displays a list of the parameters and keyword arguments for that procedure/function. You can then use the up/down arrow keys to highlight each parameter/keyword and see the detailed description of each one. If you want to include a parameter/keyword in the code you can press Enter when one is highlighted to include it in the code. When you press the next comma for the next parameter/keyword the process is repeated and you can select other parameters to include.
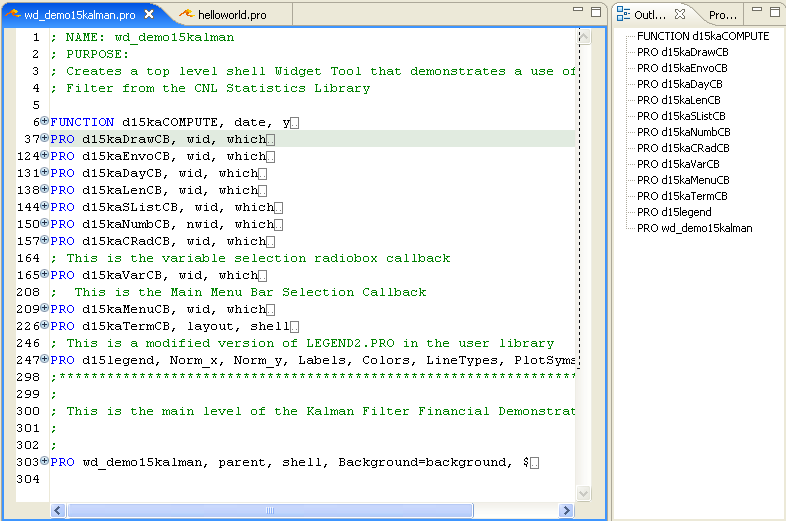
Code folding—Procedures and functions can be collapsed and expanded by clicking on the plus marker at the beginning of each procedure/function.
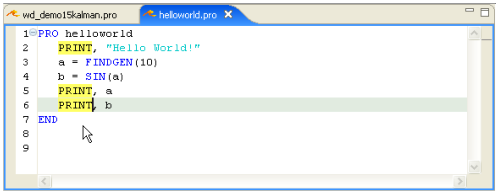
Auto Search—When you click on any token such as a variable, procedure, or function name, all matching instances of this token are highlighted in the file. This is very useful for following the use of a variable or procedure.
Below are examples of some editing features:
Note that the type of END should be ENDFOR but the incorrect use of ENDIF is tagged.
You can double click on a procedure/function and right click to select PV-WAVE Help in the popup window to launch full online help for this function. Multiple tabs will open in your browser for each new help opened (if your browser has tabs enabled).
Command completion shows the parameters and keywords available for a PV-WAVE procedure or function and can be used to automatically insert the text for it.
Code Folding and Outline view shows a 300 line file that has had all of its procedures collapsed. Individual procedures can be expanded/collapsed by clicking on the plus/minus icons next to the procedure name. Note the outline view on the right which shows all procedures/function in the file and can be used to quickly navigate to the desired code.
When the word “PRINT” is clicked on, all occurrences of that word are highlighted in the file.
Running PV-WAVE Code
To run a PV-WAVE procedure, the procedure name must be the same as its file name. In this example, use procedure “helloworld”, which is stored in “helloworld.pro”.
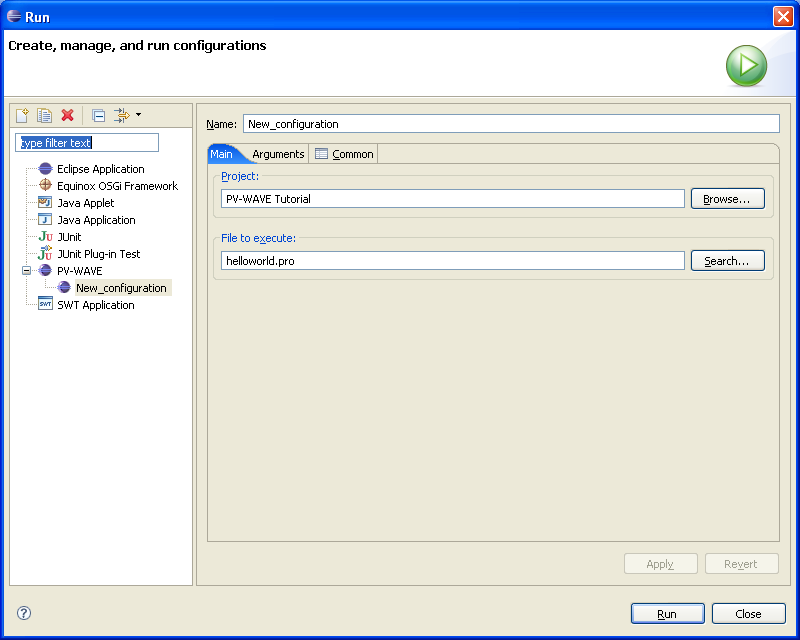
You can run a PV-WAVE procedure from the Run menu, as follows:
1. Select Run.
2. Click on “New Configuration”. The configuration name can be anything you want; for now, just leave it as the default (New_configuration)
3. Select the project. From the Browse window choose the “PV-WAVE Tutorial” directory.
4. Select the file to execute by clicking Search and then choosing “helloworld.pro”.
5. Click Run. PV-WAVE output appears in the Console view.
Debugging PV-WAVE Code
All of the editing we have done up to this point has used the PV-WAVE perspective.
When PV-WAVE Debugging is selected, you are prompted to switch to the Debug perspective. Note that the Debug perspective is the same regardless of which programming language you use, except that the editor window will be language-specific.
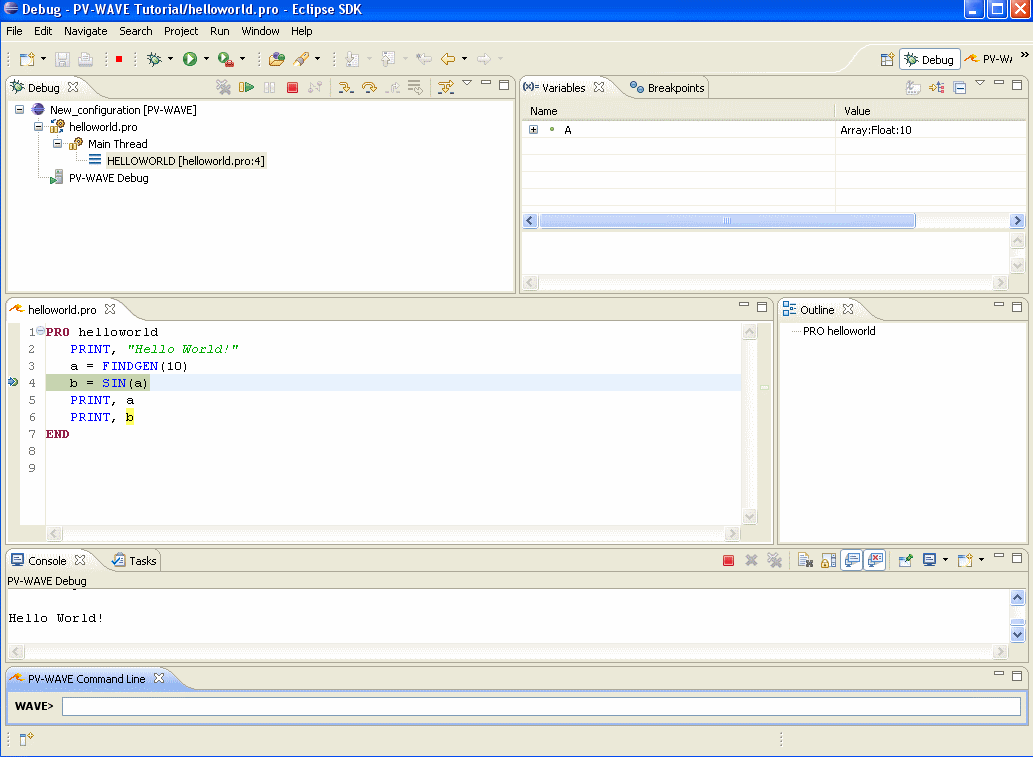
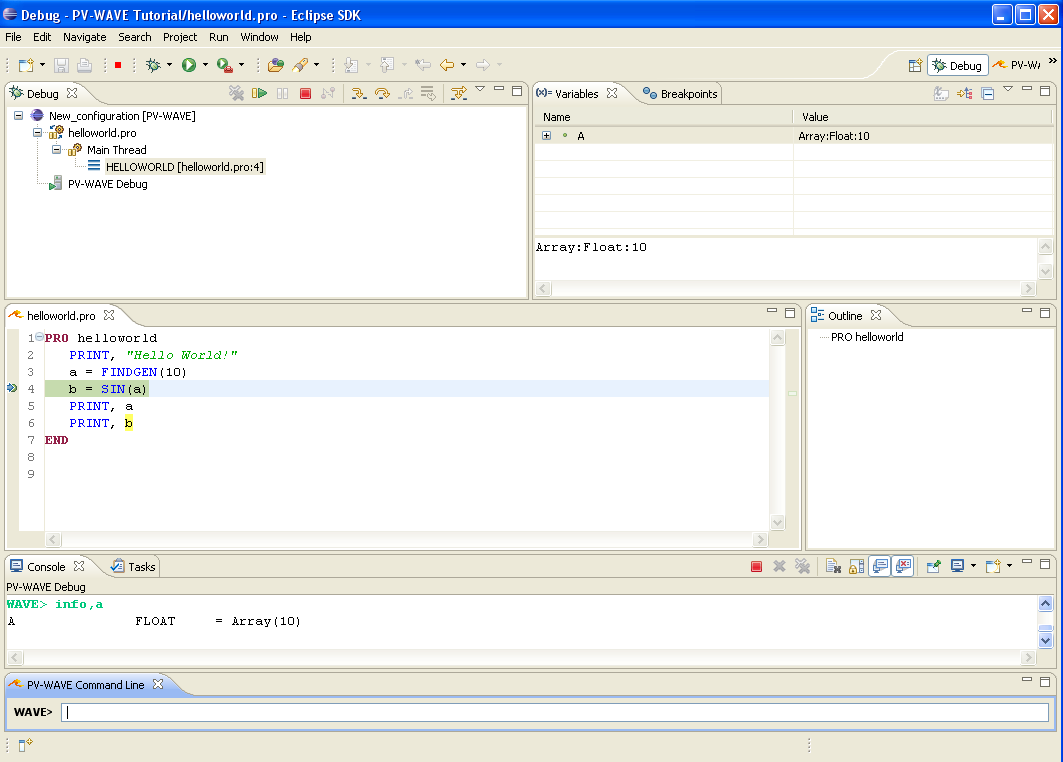
The Debug Perspective shows the debug perspective for
helloworld.pro.
There are a number of Views in the Debug perspective:
The Debug View—Shows information about the program that is currently executing, or the most recently-executed program.
The Variable View—Shows variable names and values for the current frame.
The Breakpoints View—Shows breakpoints that have been set, and whether they are active or not.
note | Breakpoints are only visible in files that are part of a project. |
The Editor View—Shows PV-WAVE source code, and highlights the current line. You can set or clear breakpoints in the Editor view.
The Outline View—Shows the names of all of the procedures in the current source file. Double-clicking on the procedure name highlights that procedure in the Editor View.
The Console View—Shows PV-WAVE output.
Try the following steps to debug your “helloworld” program.
1. Set a breakpoint at line 4. In the Editor view, there is a highlighted region to the left of the source code. Right-click in that region, and select Add Breakpoint from the dropdown menu. You can also just double click to toggle a breakpoint on and off. A green circle appears, indicating that a breakpoint exists at that line.
note | Breakpoints are only visible in files that are part of a project. |
2. Begin debugging.
a. Click on the PV-WAVE Tutorial icon in the Navigator view.
b. Select Run/Debug from the menu bar at the top of the workbench.
c. A dialog appears that is very similar to the Run dialog. Fill it in the same way, and click Debug.
d. Your program runs to the breakpoint. The line containing the breakpoint is highlighted in the Editor view.
note | Breakpoints are only visible in files that are part of a project. |
3. Click the Variables tab in the upper right of the workspace. The value of variable a is displayed.
4. Click the Breakpoints tab in the upper right of the Workspace. Your breakpoint is listed.
5. Select Step Over.
Step Over is available in two locations: (1) the Run menu, and (2) the icon toolbar in the upper left of the Workspace, next to the Debug tab.
The next line in “helloworld.pro” is highlighted, and the values of variables
a and
b are displayed.
6. Select Resume from the Run menu or the Debug icon bar. Your program runs to completion.
7. Click the red “Terminate” icon and then the “Remove All Terminated Launches” from the Debug bar to close the PV-WAVE process and clean up the Debug view.
The following debugging controls are available in the Debug perspective:
Remove all Terminated Launches—Information about debugging sessions you have launched is displayed in the Debug tab. Selecting this button clears the information about the ones that have completed.
Resume—When you hit a breakpoint in the debugger, the program is said to be suspended.
Resume requests that PV-WAVE continue execution until either the next breakpoint is hit or the program completes.
note | Breakpoints are only visible in files that are part of a project. |
Suspend—Requests that the program be suspended at the first opportunity.
Terminate—Stop running PV-WAVE, and clean up all associated debugging state information.
Step Into—If the next statement calls a PV-WAVE procedure, Step Into continues from the current point, and suspend execution at the first executable line in that procedure.
Note that Step Into only works for procedures that have associated source (.PRO) files in the PV-WAVE search path.
Step Over—Step to the next line in the current procedure, regardless of whether the current line calls any other procedures or functions.
Step Return—Continue executing until the line in the calling procedure that follows the one that references the current procedure.
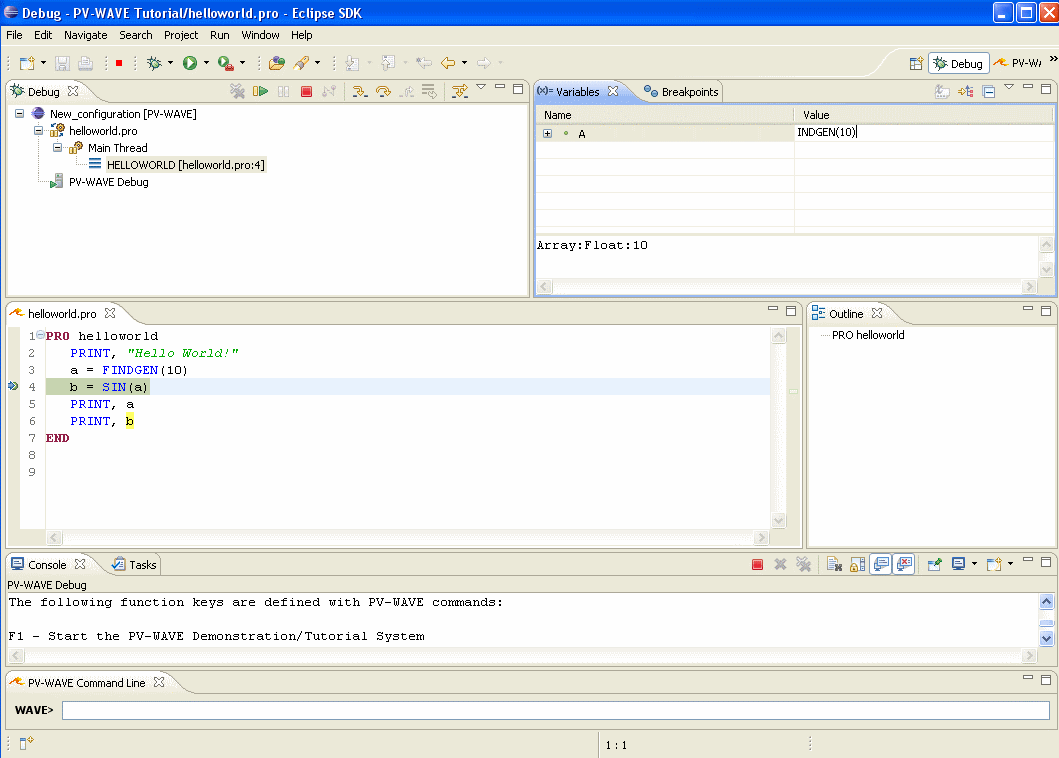
Examining and Modifying Variables
As the PV-WAVE program pauses at your breakpoint, you can use the Variable view to inspect or modify the values of variables in the program. To demonstrate it, set a breakpoint at line 4 of “helloworld.pro” and start the debugger (see above). The variable view displays the value variable “a”. To modify, select the
Value field (
Array:Float:10) and enter a new value. To change top level variables such as “a” from a float array to integer array, simply set the new value to “
indgen(10)” (See
Modify Top-Level Variable). The PV-WAVE debugger allows top-level variables to be converted to other supported PV-WAVE data types. For example, the variable “a” may be converted from a float array to a scalar integer value or even a string. However, children of the top-level variables must match the data type of top-level variable. For example, new value of an array element must match the array data type.
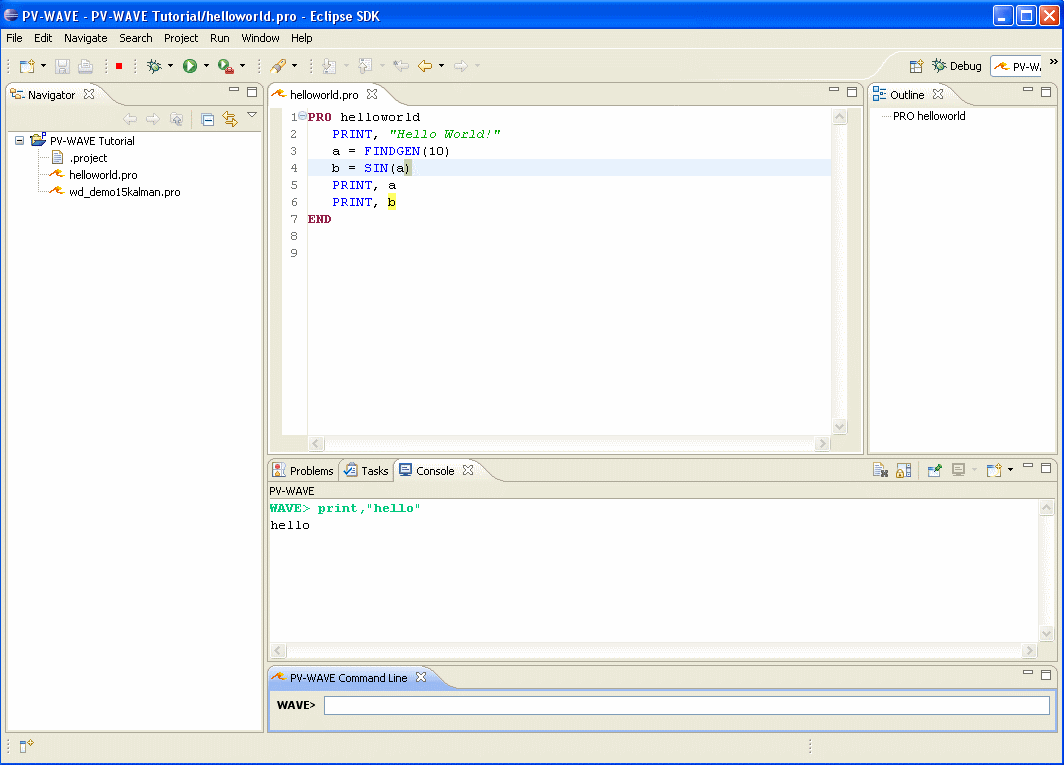
PV-WAVE Command Line
The PV-WAVE Command Line view allows you to interact with the PV-WAVE program. The interaction with PV-WAVE program is allowed at main-level and when you are running or debugging your program. By default, the main-level interaction is available in PV-WAVE perspective. All output from the PV-WAVE is sent to PV-WAVE Console view. As shown in
Main-Level PV-WAVE interaction, type the command
print,"hello" in the PV-WAVE Command Line. In addition, the command history is available by selecting up or down arrows on your keyboard.
When a PV-WAVE program is paused during either running or debugging, you can also interact with PV-WAVE from the PV-WAVE Command Line. To demonstrate it, add a breakpoint at line 4 of the “helloworld.pro”, start the debugger. While the program is paused, type “
info,a” in the PV-WAVE Command Line view (see
PV-WAVE interaction during Debug Session). It should be noted that the output from PV-WAVE during Run/Debug displays in a different Console view other than the main-level PV-WAVE Console. Once the Run/Debug is terminated, PV-WAVE output will be displayed in the main-level Console.
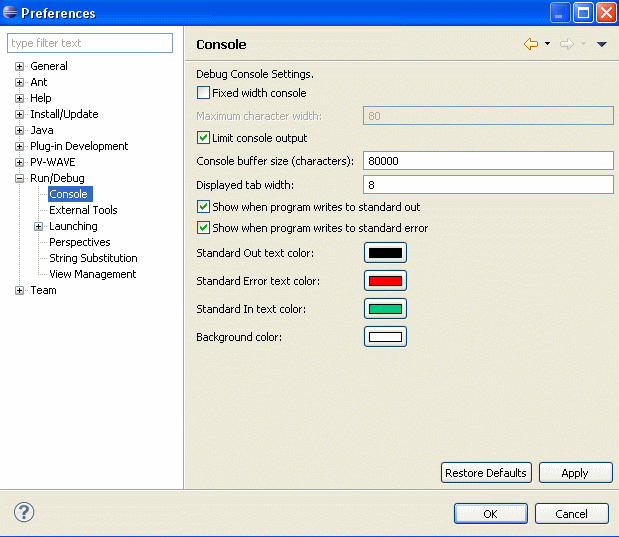
PV-WAVE Console Preferences
Specify the PV-WAVE Console preferences using the
Window ->
Preferences ->
Run/Debug ->
Console option and selecting one of the available options (see
PV-WAVE Console Preferences). The PV-WAVE Console background, standard output, standard input, and standard color preferences can be set to personalize your interaction with PV-WAVE.
For more detailed information about the Eclipse editor/debugger framework, visit the Eclipse foundation website at
www.eclipse.org.
Version 2017.1
Copyright © 2019, Rogue Wave Software, Inc. All Rights Reserved.