Lesson 2: Displaying a Series of Images
In this example, you will create an animation that shows a series of images that represent an abnormal heartbeat.
In this lesson, you’ll do the following:
Access the Data and Create the Initial Animation
First, read in the images to be displayed. The file abnorm.dat holds a series of 16 images of a horse heart stored as 64-by-64 byte arrays.
To access the data and create the initial animation, do the following:
1. Open the file and prepare it for reading by entering the following commands at the WAVE> prompt:
OPENR, 1, !Data_dir + 'abnorm.dat'
This command opens the file abnorm.dat for reading. Define a variable, h, as a 64-by-64-by-16 byte array.
2. Create a variable h to hold the images. Enter:
h = BYTARR(64, 64, 16)
3. Read the images into the variable h, using the command, READU, which reads unformatted, or byte, data. Enter:
READU, 1, h
4. Close the file abnorm.dat by entering:
CLOSE, 1
5. Load an appropriate colortable, Red Temperature, by entering:
LOADCT, 3
6. Open a window that will fit the final image. The final image size will be 256-by-256 bytes.
WINDOW, 1, XSize=256, YSize=256
7. Display the first image in the array h by entering:
TV, h(*, *, 0)
The small image appears in the lower left corner of the window.
The asterisks (*) in the first two subscript positions tell PV-WAVE to use all of the elements in those positions. Hence, the TV command displays a 64-by-64 byte image.
8. The image is rather small, so resize each image in the array with bilinear interpolation by entering:
h = REBIN(h, 256, 256, 16)
9. Redisplay the image:
TV, h(*, *, 0)
Each image in h is four times its previous size.
10. Now use the Standard Library procedure MOVIE to display each image in array h one after another. Enter:
MOVIE, h, Order=0
The animation appears.
11. Press <s> to slow the animation, <f> to speed it up, and <q> to return to the PV-WAVE command line.
Create a Surface Plot
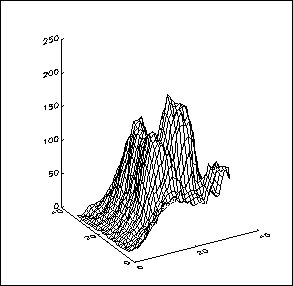
The data in abnorm.dat also can be displayed as a series of wireframe surface plots.
To animate a wire frame surface, do the following:
1. Create a new array s to hold the heartbeat data by entering:
s = REBIN(h, 32, 32, 16)
The variable s now holds sixteen 32-by-32 byte versions of the heartbeat images.
SURFACE plots are often more legible when made from a resized version of the data set with fewer data points in it.
2. Now create a new window 300-by-300 pixels wide in which to display the images.
WINDOW, 2, XSize=300, YSize=300, $
Title='PV-WAVE Animation'
3. Display the first image in s as a wire-mesh surface by entering:
SURFACE, s(*, *, 0)
4. To make the surface plots appear in color, first load 32 distinct colors:
TEK_COLOR
Create series of surface plots, one for each image in the original data set.
5. First, create a 3D array frames to hold all of the images by entering:
frames = BYTARR(300, 300, 16)
The variable frames will hold sixteen, 300-by-300 byte images. The next command draws each frame of the animation. A surface plot is drawn in the window and then the TVRD command is used to read the image from the plotting window into the frames array. The FOR loop is used to increment the array indices. The lines below are actually a single PV-WAVE command.
6. Draw each animation frame. Enter:
FOR I=0, 15 DO BEGIN SURFACE, $
Color=WoColorConvert(10), s(*, *, I), ZRange=[0, 250] & $
frames(0,0,I)=TVRD(0, 0, !D.X_VSize, !D.Y_VSize) & $
End
note | The dollar sign ($) works as a continuation character in PV-WAVE and the ampersand (&) allows multiple commands in the same line. |
A series of surface plots is drawn in the window.
note | The ZRange keyword is used to keep the surface height at the same scale for each plot. The TVRD function returns the contents of the specified rectangular portion of a displayed image. The system variables, !D.X_VSize and !D.Y_VSize, report the size of the current window and each is updated when the window is resized. |
7. Now display the new animation by entering
MOVIE, frames, Order=0
8. Press <s> to slow the animation, <f> to speed it up, and <q> to return to the PV-WAVE command line.
Version 2017.1
Copyright © 2019, Rogue Wave Software, Inc. All Rights Reserved.
