PIE_CHART Procedure
Displays data as a pie chart.
Usage
PIE_CHART, data, xcenter, ycenter, radius
Input Parameters
data — An array of data values to be displayed as a pie chart.
xcenter, ycenter — Specifies the x and y coordinates of the center of the pie chart, by default in normal coordinates.
radius — Specifies the size of the radius of the pie, by default in normal coordinates.
Keywords
Device — If nonzero, the pie chart is drawn in device coordinates. (Default: normal coordinates)
Label — A string array specifying the labels for each slice. The array must contain the same number of elements as data. If a slice is too small to display text, the label is not drawn. (Default: no labels)
Font — An integer specifying a PV‑WAVE font command. For example, 3 is the command for the font Complex Roman. Do not put an exclamation mark (!) in front of the font command. For a complete list of font commands, see the PV-WAVE User’s Guide. (Default: current font)
Charsize — Sets the overall character size for annotation. A Charsize of 1.0 is the normal; a size of 2.0 is twice as big, and so on. (Default: !P.Charsize)
Tposition — An integer or integer array specifying where to draw labels for the individual slices.

0 — Draw the label inside the slice.
1 — Draw the label outside the slice. Draw the label text horizontally.
2 — Draw the label outside the slice. Align the angle of the label text with the slice.
Tcolor — An integer array specifying colors for the labels. The colors for each label are mapped, sequentially, to the value of each array index.
Tperct — If nonzero, the percentage for each slice is displayed. (Default: the percentage is not displayed)
Tvalue — If nonzero, the value of each slice is displayed. (Default: the values are not displayed)
Tborder — If nonzero, a border is drawn around each label. (Default: no border)
Tbord_color — An integer specifying the color index for the label border. (Default: !P.Color)
Shade — A floating point value specifying the percent of displacement for a shadow under the pie chart. By default, the shadow is offset in the direction of 315 degrees. (Default: zero displacement)
Explode — A floating point scalar or array specifying how far from the center to offset or “explode” the pie slices. This value is specified as a percentage of the pie radius. If a scalar, all slices are offset by the same amount. If set to an array, the offset for each slice is mapped, sequentially, to the value of each array index. (Default: no offset)
Color — For a description of this keyword, see
Graphics and Plotting Keywords.
Discussion
PIE and PIE_CHART produce similar looking graphics. PIE includes a legend option and always ensures that label text and graphics fall within the plot window.
This procedure creates a pie chart at a specified position within the graphics window. You can add text labels and colors to individual slices of the pie. In addition, pie slices can be offset or “exploded” from the center, and slices can be given shadows for a three-dimensional look.
You can display up to 30 slices; however fewer than 15 is recommended for the best display. Labels are not displayed in any slices that are too small. If data for a particular slice represents less than 0.01% of the overall dataset, the slice is not drawn and an informational message appears.
Examples
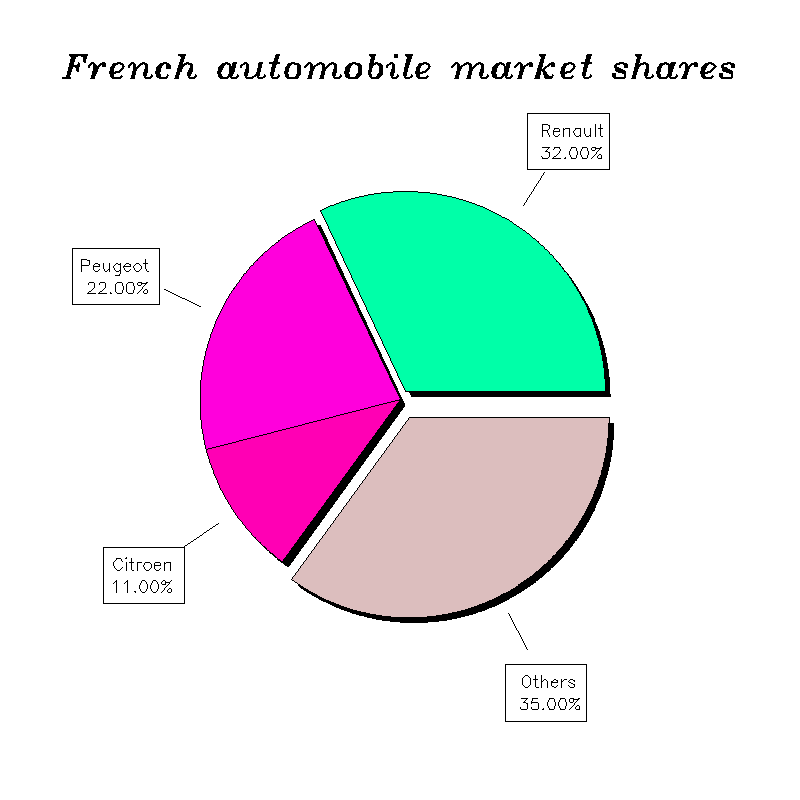
This example demonstrates how to create an exploded pie chart. The results are shown in
Figure 13-2: Exploded Pie Chart on page 908.
data = FLTARR(4)
data(0) = 32
data(1) = 22
data(2) = 11
data(3) = 35
strg = STRARR(4)
; Create labels
strg(0) = 'Renault'
strg(1) = 'Peugeot'
strg(2) = 'Citroen'
strg(3) = 'Others'
title = '!18French automobile market shares'
; Create the window
WINDOW, /Free, Xsize=500, Ysize=500
; Initialize a white background
LOADCT, 13
!P.Color = WoColorConvert(0)
!P.Background = WoColorConvert(255)
ERASE, !P.Background
; Plot the chart
PIE_CHART, data, .5, .5, .25, /Tperct, Explode=[.05,0,0,.1], $
Shade=0.04, Tposition=[1,1,1,1], /Tborder, $
Color=WoColorConvert([60,120,140,200]), $
Label=strg, Font='3', Charsize=1
XYOUTS, .5, .9, Title, Charsize=1.6, Charthick=2, Align=.5, $
/Normal, Color=WoColorConvert(0)
See Also
Version 2017.1
Copyright © 2019, Rogue Wave Software, Inc. All Rights Reserved.