SHOW3 Procedure
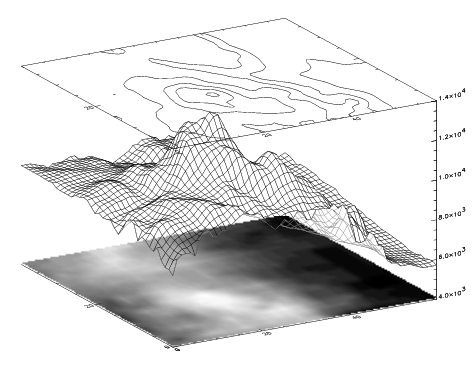
Standard Library procedure that displays a two-dimensional array as a combination contour, surface, and image plot. The resulting display shows a surface with an image underneath and a contour overhead.
Usage
SHOW3, array
Input Parameters
array—The two-dimensional array to display.
Keywords
Ax—The angle of rotation, in degrees, about the x-axis.
Az—The angle of rotation, in degrees, about the z-axis.
Bot_Image—The name of the image array to be used as the underneath image.
C_Colors—A vector of color indices whose elements indicate which color to use in drawing the corresponding contour level.
Interp—If present and nonzero, specifies that bilinear interpolation is to be used for the pixel display. Otherwise, the nearest neighbor interpolation method is used.
Sscale—The reduction scale for the surface. If set to anything other than 1 (the default value), the image size is reduced by the specified factor. If the image dimensions are not an integral multiple of Sscale, the image is reduced to the next smaller multiple.
Discussion
You can modify SHOW3, if necessary, to customize the contour and surface commands to your satisfaction (e.g., use different colors, skirts, line styles, and contour levels). See the descriptions of the CONTOUR and SURFACE routines for details.
note | When you are displaying larger images (say 50-by-50), the display produced by SHOW3 can become too “busy.” If this happens, try using the SMOOTH and/or REBIN procedures to smooth the surface plot. |
Example
This example uses the Pike’s Peak elevation and snowpack images found in:
(UNIX) <wavedir>/data
(WIN) <wavedir>\data
Where
<wavedir> is the main PV-WAVE directory. The results are shown in
Figure 16-9: Image, Surface, and Contour on page 1124.
; Open the file to read.
OPENR, 1, !data_dir + 'pikeselev.dat'
; Create the data array for the pikes elevation data.
pikes = FLTARR(60, 40)
; Read in the formatted file.
READF, 1, pikes
; Close the file.
CLOSE, 1
; Open the file to read.
OPENR, 2, !data_dir + 'snowpack.dat'
; Create the data array for snow pack data.
snow = FLTARR(60, 40)
; Read in the formatted file.
READF, 2, snow
; Close the file.
CLOSE, 2
; Load color table number 5.
LOADCT, 5
; Produce the combined display.
SHOW3, SMOOTH(pikes, 3), Bot_image=snow, /Interp
See Also
For information on interpolation methods, see the PV‑WAVE User’s Guide.
Version 2017.1
Copyright © 2019, Rogue Wave Software, Inc. All Rights Reserved.