Other Samples
This section lists other samples that are available for Objective Chart, either in the distribution or from the Web site, as noted. See
“Introduction” for the location of these samples.
• CCode (Web site)— demonstrates how the annotation list system can be used to create chart labels that automatically show or hide themselves according to a locale setting. Provides a user selectable country code (English, French) for axis labels. Uses KillGraph() and SetAnnotation().
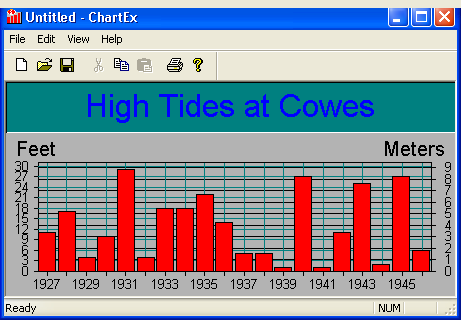
• ChartEX (Web site) — illustrates a fancy graph with a custom extension of SRGraphDisplay. The document initializes the SRGraph object with a background, title, and labels for two Y-axes. Various styles (color, fill, border, and text justification) are selected for these components. The view class overrides the OnSize() function to reposition the label components and ShowFeedback() to customize the chart tips. The display extension, SRGDualYDisplay, overrides DrawCustomAxis() and DrawCustomLabels() to create two Y-axes – one with a scale in feet, the other in meters. These functions use SRGLogScale, SRGDecimalScale, and SRGLabelBlock classes and related functions to create the axes.
• ChartOleSrv (Web site) — demonstrates how Objective Chart may be configured to run in a OLE server application. This sample application handles printing and in-place activation.
• ChartScroll— draws a basic (no frills) vertical bar chart application using CGraphDoc and SRGScrollView. The view class uses a timer to dynamically add data to the chart. OnHScroll() is overridden to set the scope using SetMinIndex() and SetMaxIndex() so that at most 40 bars are displayed at once.
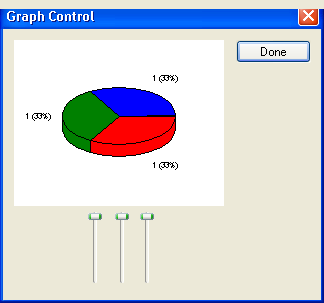
• CtrlTest— includes a simple control class,
SRGraphControl (based on
CStatic), to display charts in two different dialogs. The
ControlText dialog displays a pie chart with 3 slices. Three slider bars dynamically control the relative sizes of the slices. The
About dialog reads the configuration settings for a bar chart from a template. The bars are colored individually. The axis scale set to a fixed range. A timer is used to dynamically change the data values (the height of the bars) and the color of the background.
Figure 153 shows the
CtrlTest graph.
• DlgView— shows how a CView-based class, SREGraphView, may be used outside of the standard document view architecture.
• DrawCurve— demonstrates how axes may be customized by creating a chart which displays its axes at the origin even when the origin is not on the side of the chart.
• DynamicGraph (Web site) — demonstrates how to set up a chart that uses the Structure data storage model.
• ExData (Web site) — demonstrates the use the external data in a simple CGraphDoc/SRGraphView application. Uses SRGIntStructData to display 30,000 points in a LineOnly graph. Sets a fixed axis scale and turns feedback logging off. Good example to try out zooming features. Includes Chart Explorer.
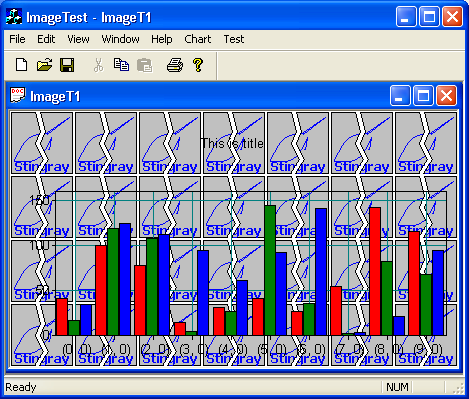
• ImageSupport (Web site) — demonstrates how the Stingray Studio image classes, which are now distributed with Objective Chart, add the ability to use images from disk in component fills.
• IndependentScale— demonstrates the use of the axis bar classes with a display component that does not draw its own axes. The sample illustrates the positioning and configuration of multiple Y-axes.
• ISAPIChart (Web site) — is a full ISAPI (Internet Server API) Extension DLL which uses Objective Chart to create JPEG images on the fly at the server which are sent to the client browser in response to an <IMG SRC=……..> tag. This allows Objective Chart images to be distributed to browsers that do not support ActiveX.
• OCApp— displays a 3D bar graph with a few simple frills. The display component has a border, shadow, and X grid. A background and a basic legend are added. All three components have a solid color fill and use the percentage measurement mode. The view is based on CView, so mousing about with the data is not allowed.
• PlotterDlg (Web site) — uses a CStatic-based control class in a dialog based application to contain and display the graph object. The display component is a special extension of SRGraphDisplay that overrides DrawCustomAxis() and DrawCustomLabels() to create a XY scatter graph with a time-based X-axis (SRGDateScale). DrawData() is overridden to allow the axes to be drawn even if the chart has no data. The dialog class handles mouse clicks (OnLButtonUp) and adds points to the chart. The Y value of the point is determined by the vertical position of the mouse cursor. The X-value is the time based on a simulated clock using a timer.
• PMon— displays a chart resembling a Performance Monitor in a bare-bones application. The CView-based view class handles all the action. OnInitialUpdate() sets up an area graph to display 100 SRGraphData items. SetShowIndices(FALSE) is called so that the X-axis remains unlabeled. OnTimer() calls RollGroup() to shift the data from right to left and add a new data value.
• PrintDemo (Web site) — demonstrates how the view's printing mechanism can be customized to print the chart differently than it is displayed on the screen. For example, header and footer text can be added.
• ResizeTest— demonstrates the use of CalcFinalRect() to reposition other components to be adjacent to resizeable components. It also illustrates the use of GetLogRect() for hit-testing the various components.
• Scatter— uses four document templates with the same document type but different views. When a new document is created (File|New), the user can select one of the four views or graph types:
— View 1 = CX_GRAPH_XYSCATTERA —data in alternating data objects
— View 2 = CX_GRAPH_XYSCATTERI— X in even indices, Y in odd indices
— View 3 = CX_GRAPH_XYSCATTERG— X in even groups, Y in odd groups
— View 4 = CX_GRAPH_GANTT— axis type = CX_AXIS_GANTT_DATE
• SimpleCustom— illustrates a standard application using CGraphDoc and SRGraphView. A customized SRGraphDisplay extension, SimpleCustomDisplay, overrides DrawClassicLabels() to rotate the X-axis labels to 45 degrees and to format the Y-axis labels as Lbs x.xx. The SimpleCustom sample also demonstrates how a chart can be imported or exported to an XML file.
• SyncDisp— demonstrates how to overlay graphs with different types on the same axes. The master chart displays the data in group 0 as a bar chart and sets the Y-axis range. Two slave charts are added. One slave displays the data in group 1 as a thick line, using the freehand graph type after setting the object styles using SetObjectStyle(CX_OBJECT_LINE) and SetGlobalStyle(). The other slave displays the data in group 2 as another vertical bar chart. Both slave components are given the axis style of CX_AXIS_NONE, and their fill style is set to CX_NO_FILL so that the master component is not erased. All display components use SetScope() to select their groups. The slave display components are instances of a custom SRGraphDisplay extension (SyncDisplay) that gets its display rectangle, axis ranges, and zoom scales from the first display component in the component list. This causes the slave displays to properly overlay the first (master) display component.
• USDChart— displays a XY scatter graph using a more extensive override of SRGraphDisplay. USDDisplay overrides DrawLineData(), DrawClassicLabels(), DrawClassicAxis(), DrawScatterData(), and DrawScatterLabels() to create a Y-axis with the origin at the top and with values increasing downward. SRGraphPosition is subclassed also, and the view class contains an override of GetPosition() that uses the new graph position class. This axis could be used for displaying temperature versus depth in the ocean, for example.
• WizDemo— shows how to set up and use the Chart Wizard.
Utility Toolkit Samples
This sample requires the separately built Utility Toolkit library.
• FTChart (Web site) — shows how to use the new Objective Chart Utility Toolkit (OCUT) Fourier Transform chart.
• StatisticChart (Web site) — shows how to create a statistical chart simply and quickly using the Objective Chart Utility Toolkit (OCUT).
• Histogram (Web site) — shows how to use the Histogram chart of the Utility Toolkit to analyze the color intensities in an image.
• HistogramDlg (Web site) — displays a histogram of generic floating point data as a control in a dialog.
• CurveFitChart — calculates and plots a least squares fit to a series of observed data points (x,y).
Samples from the Demo Gallery
• DynaGraph — demonstrates the use of the Dynamic data storage model with an override of GetAnnotation() to supply axis labels based on the current index.
• Hilite (Web site) — highlights bars automatically as the mouse is positioned over them.
• GanttText (Web site) — displays text inside of bars. Derives class from SRGraphDisplay and overrides DrawBar() to handle bars for Gantt chart. Uses many functions of SRGraphLabel. Also sets the clipping region.
• TitleEx (Web site) — creates a chart with headers and footers. A new class derived from SRGraphTitle overrides GetParentContent() to do nothing. This permits the title component to display any text.
• DataCursor — displays a vertical or horizontal line under the mouse cursor. Calls DrawCursor() from OnDraw() and OnMouseMove().
• ScrollScatter (Web site) — uses scroll bars to pan a 10x10 window around a 100x100 chart. Sets up SCROLLINFO and overrides OnHScroll() and OnVScroll().
• VbarTags (Web site) — demonstrates the use of data tags in a vertical bar chart.
VCompound Chart Lesson
The <stingray-installdir>\Samples\Chart\CChartLesson directory contains a tutorial document and five projects that illustrate some tips and possible pitfalls for using compound displays. In addition, there is a project, MultiPie (available from the Web site), that uses a compound component to arrange and display a variable number of pie graphs and their titles.
Grid and Chart Samples
The following samples require both Objective Grid and Objective Chart. FrstGrph can be found in <stingray-install>\Samples\Chart\GridAndChart. The others (as indicated) are available from the Rogue Wave Web site.
• OCinCellInteractive (Web site) — embeds a chart within a range of grid cells. The chart control displays a graph of the grid data. If the user selects a group of cells, the chart graphs the selected data. The graph is automatically updated when the grid data are edited. The data from the currently active cell is highlighted in the chart. In addition, graphic objects (bars, lines, wigets) in the chart can be dragged by the mouse. The corresponding values in the grid are automatically updated. The customized classes used in this sample are described in a text file, OCinCellInteractive.txt.
• GridChartSplit (Web site) — provides the same functionality as OCinCellInteractive except the grid and chart views are in different panes of a splitter window.
• FrstGrph and MultiGrph (Web site) — Both FrstGrph and MultiGrph demonstrate Objective Chart's Communication Document System (SECComDoc). The grid and chart are stored in separate document classes. The ComDoc system enables the two document types to communicate keeping the grid and chart data synchronized. Changes to the data in a grid cell are automatically updated in the chart and data items in the chart can be dragged, changing the values in the grid. MultiGrph uses the standard Objective Chart document and view classes, CGraphDoc and SRGraphView, so you will only see grid-related classes in Visual Studio's ClassView. For more information, see CMultigrphApp::InitInstance().
In both FrstGrph and MultiGrph, the grid view creates and initializes the chart document and view. The grid data to be plotted is passed to the CGraphDoc in a tab-delimited text file in memory. The chart setup is passed to the CGraphDoc in a text template file. While FrstGrph uses the template file for the entire chart setup, MultiGrph uses a minimal, default template and then adds components to the chart by directly accessing the SRGraph member of the CGraphDoc returned by SECComDoc's special OnFileNew() function.
FrstGrph and MultiGrph are advanced samples. They are intended to illustrate the power of the Communication Document System to allow synchronization of data in different documents. The configuration is complex and an understanding of SECComDoc is required. Many features of Objective Chart are not supported by the template file. Therefore, the other Grid and Chart samples are probably better models for your applications.