CChart Example
The CChart example that is included in the Objective Chart kit shows how SRGCompoundDisplay is used and how a customized chart can be built from sub-components.
The relevant portions of the OnNewDocument() function are shown below. Some additional style settings have been added for illustrative purposes. Additional comments have been inserted to clarify various portions of the code.
// We build a simple two axis chart with fixed ratio
// axes that convert millimeters to inches
//This display wraps and manages all the other items.
SRGCompoundDisplay *pCD=new SRGCompoundDisplay;
// First, let’s set up the axis scales
SRGDecimalScale *pDS=new SRGDecimalScale;
pDS->SetResolution(100.0); // 100 mm
pDS->SetFormatString(“%g mm”);
pDS->SetLabelSide(FALSE);
pCD->SetYLabelA(pDS); // set labels for left axis
pDS=new SRGDecimalScale;
pDS->SetResolution(1.0); // one inch
pDS->SetLabelSide(TRUE);
pCD->SetYLabelB(pDS); // set labels for right axis
pDS=new SRGIndexScale;
pDS->SetLabelSide(FALSE);
pDS->SetResolution(0); // auto scale the indices
pDS->GetStyle()->SetAutoOrientation(FALSE);
pDS->SetOrientation(45);
pDS->SetLocationPoint(SRGraphLabel::TopCenter);
pCD->SetXLabelA(pDS); // X axis scale
// set tick marks on the three axes
SRGTickMarks *pT=new SRGTickMarks; // add tic marks
pT->SetMajorTickColor(CXCLR_BLUE); // blue
pT->SetMinorTickRatio(0); // no minor ticks
pT->SetMajorTickWidth(3); // fat
pT->SetTickSide(FALSE);
pCD->SetXTickMarksA(pT);
pT=new SRGTickMarks;
pT->SetMajorTickColor(CXCLR_RED); // red
pT->SetMinorTickRatio(0); // no minor ticks
pT->SetMajorTickWidth(1); // normal
pT->SetTickSide(FALSE);
pCD->SetYTickMarksA(pT);
pT=new SRGTickMarks;
pT->SetMajorTickColor(CXCLR_GREEN); // green
pT->SetMinorTickRatio(1); // minor ticks
pT->SetMajorTickWidth(1); // normal
pT->SetTickSide(TRUE);
pCD->SetYTickMarksB(pT);
// Each axis will have an individual grid line style
SRGGridLines *pG=new SRGGridLines;
pG->SetMajorGridColor(CXCLR_BLUE); // blue
pG->SetMajorGridStyle(PS_SOLID); // solid
pG->SetMinorGridRatio(0); // no minor grids
pG->SetMajorGridWidth(2); // fat
pCD->SetXGridLinesA(pG);
pG=new SRGGridLines;
pG->SetMajorGridColor(CXCLR_RED); // red
pG->SetMajorGridStyle(PS_DOT); // dots
pG->SetMinorGridRatio(0); // no minor grids
pG->SetMajorGridWidth(1); // normal
pCD->SetYGridLinesB(pG);
pG=new SRGGridLines;
pG->SetMajorGridColor(CXCLR_GREEN); // green
pG->SetMajorGridStyle(PS_DASH); // dashes
pG->SetMinorGridRatio(1); // at the half mark
pG->SetMajorGridWidth(1); // normal
pCD->SetYGridLinesA(pG);
Here the relationship between the two y-axes is established. First, the display is told that there is a correlation.
pCD->SetYRelationship(TRUE);
Then the conversion ratio between the right and left axes is specified. Note that setting this ratio to zero will invoke a special function that can be overridden to do more complex conversion. (For example, temperature conversion between degrees Celsius and degrees Fahrenheit.)
pCD->SetYRatio(1.0/25.4);// inches to millimeters
This code sets ups the display. Note that the display has a deferred draw setting. This ensures that its final graphic output is generated after all the other items (grids, etc.) are drawn. It is also possible do tell this item not to defer drawing and defer all the grid lines. That way the grids will be shown on top of the data.
SRGraphDisplay *pD=new SRGraphDisplay;
pD->GetStyle()->SetGraphStyle(CX_GRAPH_VBAR);
pD->GetStyle()->SetAxisStyle(CX_AXIS_CLASSIC);
pD->GetStyle()->SetDeferDraw(TRUE);
// fixed axis limits
pD->GetStyle()->SetUseMaxScale(TRUE);
pD->SetMinRangeY(.0);
pD->SetMaxRangeY(4000.);
pCD->SetYGraphDisplayA(pD);// set chart display
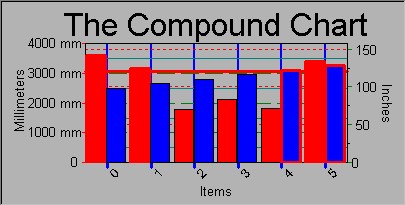
The next four sections create and register labels that are used to annotate the four axes. Note how the font size of last label is adjusted to create a title for the chart. Labels that are displayed on the sides of the chart are oriented to read vertically so that they take up far less space. SetParent() is called because GetAnnotation() requires the parent SRGraph object’s country code.
SRGraphLabel * pL=new SRGraphLabel;
pL->SetParent(&m_Graph);
pL->SetAnnotation("Millimeters");
pCD->GetYAxisA()->RegisterTitle(pL);
pL=new SRGraphLabel;
pL->SetParent(&m_Graph);
pL->SetAnnotation("Inches");
pCD->GetYAxisB()->RegisterTitle(pL);
pL=new SRGraphLabel;
pL->SetParent(&m_Graph);
pL->SetAnnotation("Items");
pCD->GetXAxisA()->RegisterTitle(pL);
pL=new SRGraphLabel;
pL->SetParent(&m_Graph);
pL->SetAnnotation("The Compound Chart");
pL->SetFontSize(24);
pCD->GetXAxisB()->RegisterTitle(pL);
// Now add a data watcher to highlight things
// more than 10 ft long!
SRGDataWatcher *pDW=new SRGDataWatcher;
// trigger type is already set but...
pDW->SetScanType(CX_SCAN_ABOVELIMIT);
pDW->SetHighLimit(25.4*120);//(Ten feet in mm)
// Data watcher is based on SRGGridLines
// so the same styles can be used
pDW->SetMajorGridColor(CXCLR_RED);
pDW->SetMajorGridWidth(3);
pCD->SetYDataWatcherA(pDW);
The single compound component with all its sub-components is placed onto the SRGraph m_ComponentList.
m_Graph.AddComponent(pCD);
This code creates the chart in
Figure 141.